Gold Price Forecast: XAU/USD retreats sharply as investors seek high-yielding assets
Premium|
Take advantage of 50% OFF on your first month.
Start your subscription and get access to all our original articles.
You have reached your limit of 5 free articles for this month.
Get all exclusive analysis, access our analysis and get Gold and signals alerts
Elevate your trading Journey.
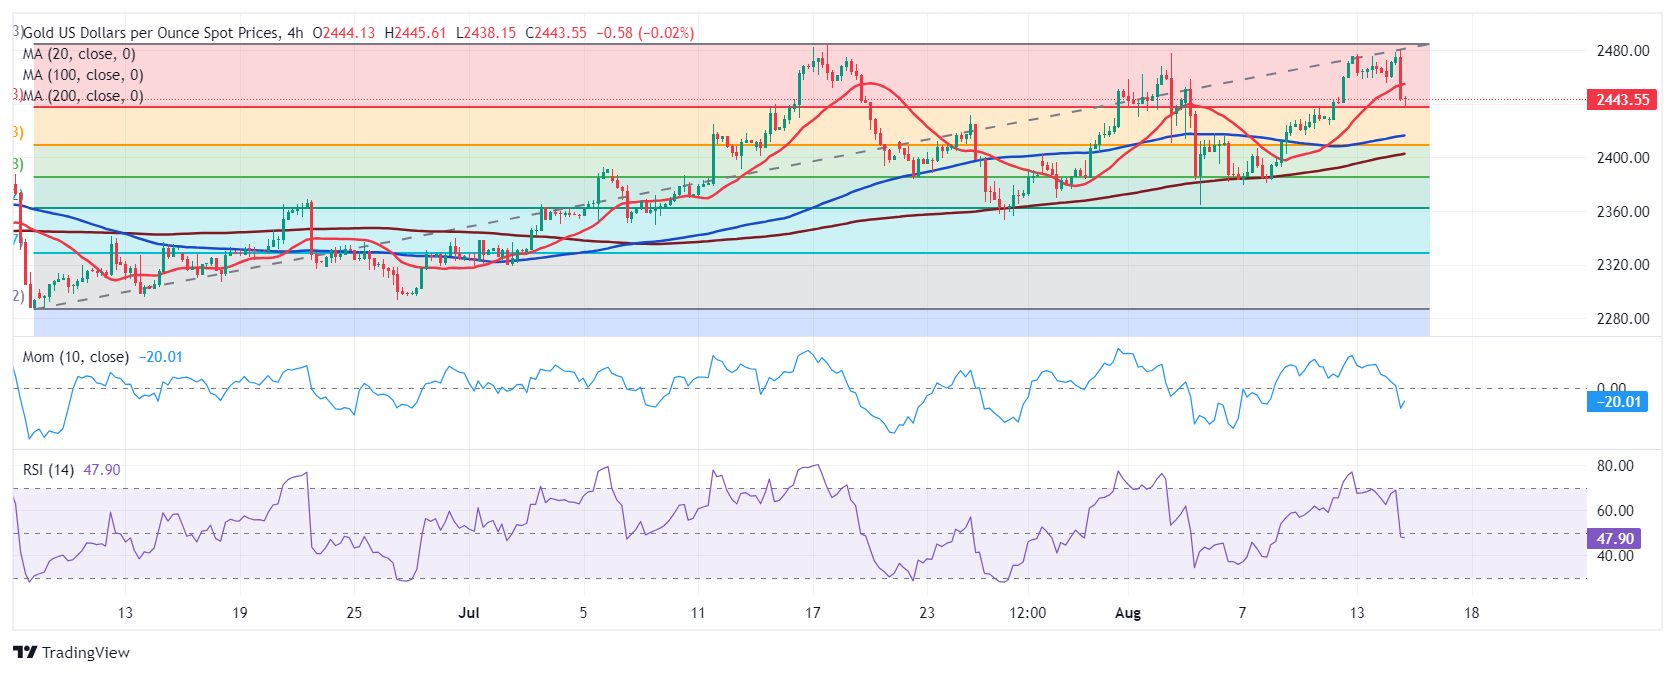
UPGRADEXAU/USD Current price: $2,443.88
- The United States Consumer Price Index resulted marginally softer in July.
- Market participants keep beating the Federal Reserve will trim rates in September.
- XAU/USD could extend its slide once clearly below $2,438.80, a Fibonacci support level.
The US Dollar started the day on the back foot, shedding ground against most major rivals as optimistic investors lift bets for an upcoming Federal Reserve (Fed) rate cut on Tuesday. The United States (US) published softer-than-anticipated inflation-related figures before finally revealing the July Consumer Price Index (CPI) on Wednesday.
According to the Bureau of Labor Statistics (BLS), the CPI rose by 2.9% on a yearly basis in July, easing from the 3% posted in June. The annual core CPI, which excludes volatile food and energy prices, rose 3.2%, below the 3.3% previous, although matching expectations. Finally, inflation rose 0.2% on a monthly basis, as expected. The figures initially sent the USD further down, although not enough to trigger relevant breakouts.
As per XAU/USD, the pair peaked at $2,479.80 with the news but turned south afterwards as demand for high-yielding assets weighed on the bright metal. The pair finally collapsed after Wall Street’s opening, as the Dow Jones Industrial Average (DJIA) and the S&P500 ran to fresh weekly highs.
For the most, US CPI figures confirmed what the market hopes: that the Federal Reserve (Fed) will trim interest rates in its September meeting, not only because of inflation easing but also because of the risk high rates pose to economic growth.
XAU/USD short-term technical outlook
From a technical perspective, the daily chart for XAU/USD suggests the bearish potential remains limited. The pair found an intraday bottom at around the 23.6% Fibonacci retracement of the June/July rally at $2,438.80, now holding above the level. At the same time, technical indicators have lost their upward strength but remain within positive levels. Only the Relative Strength Index (RSI) turned south but stays far from confirming another leg south. Finally, XAU/USD keeps developing above all its moving averages, with the 20 Simple Moving Average (SMA) now flat at around $2,417.50.
Technical readings in the 4-hour chart, however, show the slide may continue, particularly if XAU/USD slides below the aforementioned Fibonacci support. Technical indicators retreated sharply from near overbought readings and are currently hovering around their midlines, partially losing the bearish momentum but still heading south. At the same time, XAU/USD broke below its 20 SMA, which stands at around $2,455.00. The 100 and 200 SMAs remain below the current level, somehow suggesting a steeper decline is not yet on the cards.
Support levels: 2,438.80 2,4260.90 2,438.80
Resistance levels: 2,458.70 2,471.10 2,483.70
XAU/USD Current price: $2,443.88
- The United States Consumer Price Index resulted marginally softer in July.
- Market participants keep beating the Federal Reserve will trim rates in September.
- XAU/USD could extend its slide once clearly below $2,438.80, a Fibonacci support level.
The US Dollar started the day on the back foot, shedding ground against most major rivals as optimistic investors lift bets for an upcoming Federal Reserve (Fed) rate cut on Tuesday. The United States (US) published softer-than-anticipated inflation-related figures before finally revealing the July Consumer Price Index (CPI) on Wednesday.
According to the Bureau of Labor Statistics (BLS), the CPI rose by 2.9% on a yearly basis in July, easing from the 3% posted in June. The annual core CPI, which excludes volatile food and energy prices, rose 3.2%, below the 3.3% previous, although matching expectations. Finally, inflation rose 0.2% on a monthly basis, as expected. The figures initially sent the USD further down, although not enough to trigger relevant breakouts.
As per XAU/USD, the pair peaked at $2,479.80 with the news but turned south afterwards as demand for high-yielding assets weighed on the bright metal. The pair finally collapsed after Wall Street’s opening, as the Dow Jones Industrial Average (DJIA) and the S&P500 ran to fresh weekly highs.
For the most, US CPI figures confirmed what the market hopes: that the Federal Reserve (Fed) will trim interest rates in its September meeting, not only because of inflation easing but also because of the risk high rates pose to economic growth.
XAU/USD short-term technical outlook
From a technical perspective, the daily chart for XAU/USD suggests the bearish potential remains limited. The pair found an intraday bottom at around the 23.6% Fibonacci retracement of the June/July rally at $2,438.80, now holding above the level. At the same time, technical indicators have lost their upward strength but remain within positive levels. Only the Relative Strength Index (RSI) turned south but stays far from confirming another leg south. Finally, XAU/USD keeps developing above all its moving averages, with the 20 Simple Moving Average (SMA) now flat at around $2,417.50.
Technical readings in the 4-hour chart, however, show the slide may continue, particularly if XAU/USD slides below the aforementioned Fibonacci support. Technical indicators retreated sharply from near overbought readings and are currently hovering around their midlines, partially losing the bearish momentum but still heading south. At the same time, XAU/USD broke below its 20 SMA, which stands at around $2,455.00. The 100 and 200 SMAs remain below the current level, somehow suggesting a steeper decline is not yet on the cards.
Support levels: 2,438.80 2,4260.90 2,438.80
Resistance levels: 2,458.70 2,471.10 2,483.70
Information on these pages contains forward-looking statements that involve risks and uncertainties. Markets and instruments profiled on this page are for informational purposes only and should not in any way come across as a recommendation to buy or sell in these assets. You should do your own thorough research before making any investment decisions. FXStreet does not in any way guarantee that this information is free from mistakes, errors, or material misstatements. It also does not guarantee that this information is of a timely nature. Investing in Open Markets involves a great deal of risk, including the loss of all or a portion of your investment, as well as emotional distress. All risks, losses and costs associated with investing, including total loss of principal, are your responsibility. The views and opinions expressed in this article are those of the authors and do not necessarily reflect the official policy or position of FXStreet nor its advertisers.


![EUR/USD breakdown under $1.1300 targets $1.1050 [Video]](https://editorial.fxsstatic.com/images/i/EURUSD-bearish-object_XtraSmall.png)