Gold Price Forecast: XAU/USD poised to test $1900 amid a bull pennant, focus on FOMC minutes
Premium|
You have reached your limit of 5 free articles for this month.
Get all exclusive analysis, access our analysis and get Gold and signals alerts
Elevate your trading Journey.
UPGRADE- Gold consolidates in a tight range before the next push higher.
- Investors await the FOMC minutes, as gold hovers near multi-month tops.
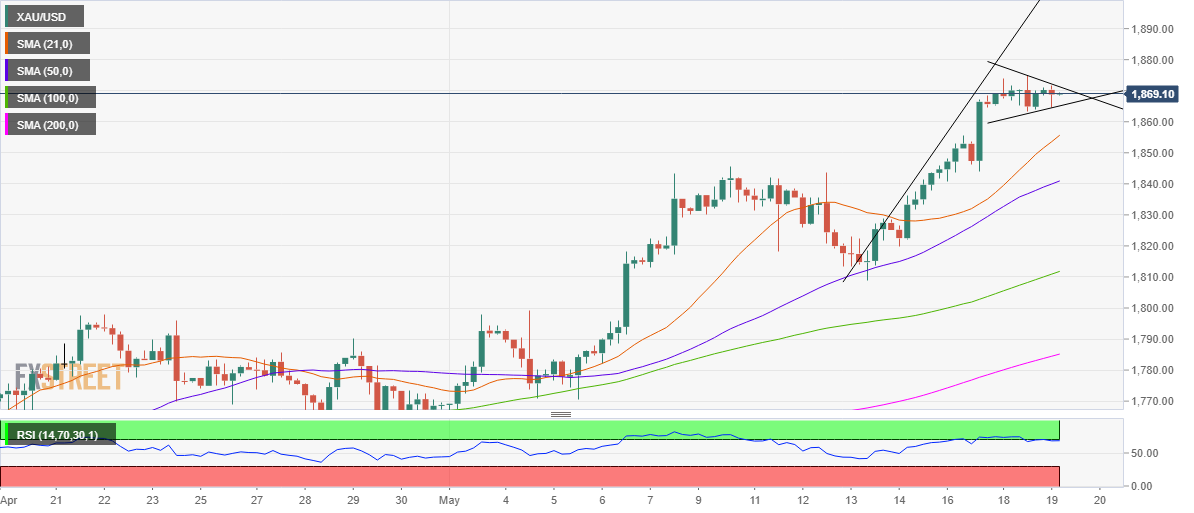
- A potential bull pennant on the 4H chart keeps gold buyers hopeful.
Gold (XAU/USD) consolidated in a tight range near three-month highs for the most part of Tuesday, unable to find a strong footing above the $1870 level. The decline in the US dollar, amid upbeat market mood and weaker housing data, failed to motivate gold price, as the Treasury yields continued to hold the higher ground, with the 10-year rates around 1.65%. The optimism over the economic reopening Euro area combined with encouraging vaccine patent waiver news kept the sentiment buoyed, keeping a check on gold’s upside. Meanwhile, gold’s corrective pullback was limited by growing concerns over higher inflation expectations, which weighed on the Wall Street indices.
In the lead up to the FOMC minutes showdown, gold extends its consolidative mode below $1870, as a sense of caution prevails, with investors closely following the inflation narrative. The FOMC minutes are expected to read dovish while reiterating the Fed policymakers’ stance on rising inflation as ‘transitory’. The Fed minutes could reinforce the dovish expectations, which could trigger a fresh rally in gold price while smashing the greenback across the board. In the meantime, the dollar dynamics will continue to influence gold’s price action. It’s worth noting that inflows into gold exchange-traded funds (ETF) have increased, as it is seen as an inflation hedge.
Gold Price Chart - Technical outlook
Gold: Four-hour chart
The recent surge that followed a consolidation has carved out a bull pennant on the four-hour chart, with the uptrend likely to continue on a sustained break above the falling trendline resistance at $1871.
The three-month highs of $1874 could be put to test once again, opening doors towards the $1900 mark.
The Relative Strength Index (RSI) has retraced from the overbought territory, allowing room for more upside.
On the flip side, a four-hourly closing below the rising trendline support at $1865 could invalidate the bullish continuation formation.
The upward-pointing 21-simple moving average (SMA) at $1855 is likely to test the bearish commitments.
The next line of defense for gold bulls is seen at the $1850 psychological level.
- Gold consolidates in a tight range before the next push higher.
- Investors await the FOMC minutes, as gold hovers near multi-month tops.
- A potential bull pennant on the 4H chart keeps gold buyers hopeful.
Gold (XAU/USD) consolidated in a tight range near three-month highs for the most part of Tuesday, unable to find a strong footing above the $1870 level. The decline in the US dollar, amid upbeat market mood and weaker housing data, failed to motivate gold price, as the Treasury yields continued to hold the higher ground, with the 10-year rates around 1.65%. The optimism over the economic reopening Euro area combined with encouraging vaccine patent waiver news kept the sentiment buoyed, keeping a check on gold’s upside. Meanwhile, gold’s corrective pullback was limited by growing concerns over higher inflation expectations, which weighed on the Wall Street indices.
In the lead up to the FOMC minutes showdown, gold extends its consolidative mode below $1870, as a sense of caution prevails, with investors closely following the inflation narrative. The FOMC minutes are expected to read dovish while reiterating the Fed policymakers’ stance on rising inflation as ‘transitory’. The Fed minutes could reinforce the dovish expectations, which could trigger a fresh rally in gold price while smashing the greenback across the board. In the meantime, the dollar dynamics will continue to influence gold’s price action. It’s worth noting that inflows into gold exchange-traded funds (ETF) have increased, as it is seen as an inflation hedge.
Gold Price Chart - Technical outlook
Gold: Four-hour chart
The recent surge that followed a consolidation has carved out a bull pennant on the four-hour chart, with the uptrend likely to continue on a sustained break above the falling trendline resistance at $1871.
The three-month highs of $1874 could be put to test once again, opening doors towards the $1900 mark.
The Relative Strength Index (RSI) has retraced from the overbought territory, allowing room for more upside.
On the flip side, a four-hourly closing below the rising trendline support at $1865 could invalidate the bullish continuation formation.
The upward-pointing 21-simple moving average (SMA) at $1855 is likely to test the bearish commitments.
The next line of defense for gold bulls is seen at the $1850 psychological level.
Information on these pages contains forward-looking statements that involve risks and uncertainties. Markets and instruments profiled on this page are for informational purposes only and should not in any way come across as a recommendation to buy or sell in these assets. You should do your own thorough research before making any investment decisions. FXStreet does not in any way guarantee that this information is free from mistakes, errors, or material misstatements. It also does not guarantee that this information is of a timely nature. Investing in Open Markets involves a great deal of risk, including the loss of all or a portion of your investment, as well as emotional distress. All risks, losses and costs associated with investing, including total loss of principal, are your responsibility. The views and opinions expressed in this article are those of the authors and do not necessarily reflect the official policy or position of FXStreet nor its advertisers.
