Gold Price Forecast: XAU/USD extends slide to fresh two-month low
Premium|
You have reached your limit of 5 free articles for this month.
Take advantage of the Special Price just for today!
50% OFF and access to ALL our articles and insights.
Subscribe to PremiumXAU/USD Current price: $2,586.03
- United States inflation met market expectations in October, still above the Fed’s goal.
- Stock markets remain under pressure, albeit Wall Street fights back on Wednesday.
- XAU/USD remains under pressure and aims to extend its slump in the near term.

After shedding some ground throughout the first half of the day, the US Dollar is back in fashion. The American currency trades with a firmer tone after Wall Street’s opening and the release of the United States (US) October Consumer Price Index (CPI), having reached fresh weekly highs against most major rivals. In the case of XAU/USD, the pair dipped below $2,600 but bounced back above it, currently struggling to extend its gains.
The US Bureau of Labor Statistics reported that the CPI rose at an annualized pace of 2.6% in October and was up by 0.2% on a monthly basis, matching expectations. The core annual figure printed at 3.3%, which was also in line with the forecast. The US Dollar ticked lower as an immediate reaction to the news but resumed its advance as US indexes quickly trimmed pre-opening gains.
At the time of writing, however, market participants are battling to establish a trend. The USD retains its strength, but the momentum eased, while US indexes pared the bleeding, with only the Nasdaq Composite trading in the red. The macroeconomic excitement will likely recede as the US has no other relevant figure to release for the rest of the week.
XAU/USD short-term technical outlook
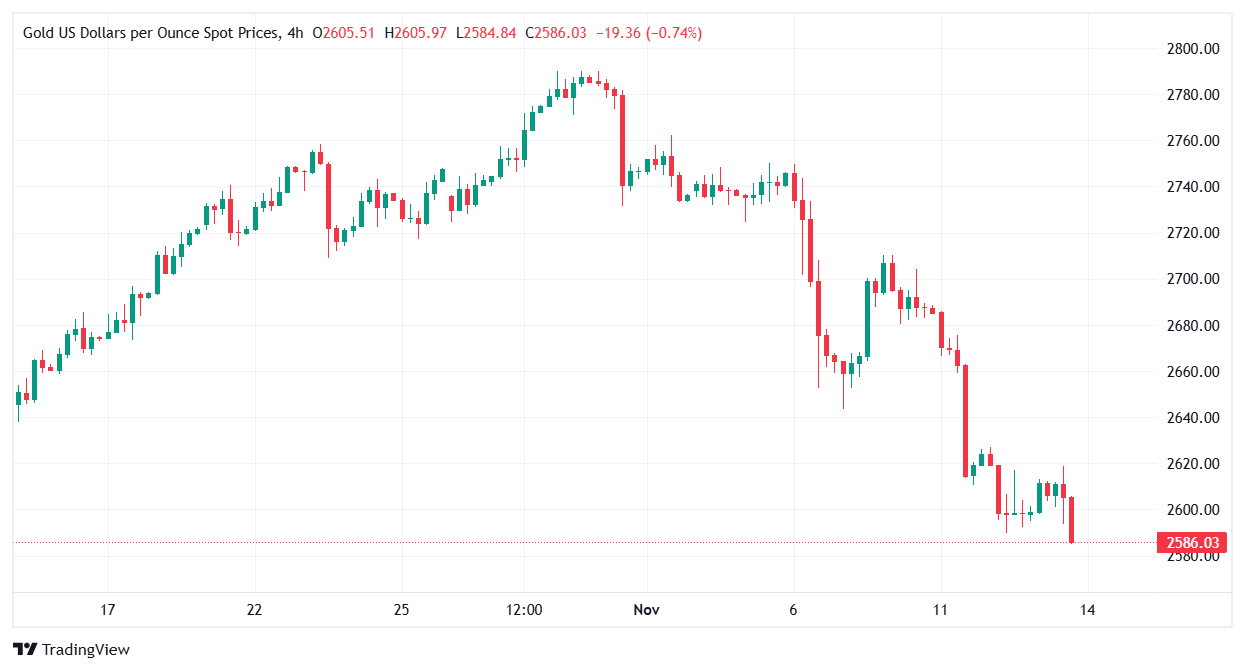
XAU/USD trades at its lowest in two months in the $2,580 region and is technically poised to extend its slump. The daily chart shows the pair remains above 100 and 200 bullish moving averages, albeit the 20 Simple Moving Average (SMA) gains downward traction above the current level. Technical indicators, in the meantime, head firmly south within negative levels. The 100 SMA provides support at around $2,540.65.
In the near term, and according to the 4-hour chart, XAU/USD downward momentum remains strong. The intraday high was set below a firmly bearish 20 SMA, which extends its slope below the longer moving averages. Finally, technical indicators turned sharply lower after correcting oversold conditions, anticipating another leg south.
Support levels: 2,572.45 2,560.65, 2,545.20
Resistance levels: 2,600.10 2,612.60, 2,627.10
XAU/USD Current price: $2,586.03
- United States inflation met market expectations in October, still above the Fed’s goal.
- Stock markets remain under pressure, albeit Wall Street fights back on Wednesday.
- XAU/USD remains under pressure and aims to extend its slump in the near term.
After shedding some ground throughout the first half of the day, the US Dollar is back in fashion. The American currency trades with a firmer tone after Wall Street’s opening and the release of the United States (US) October Consumer Price Index (CPI), having reached fresh weekly highs against most major rivals. In the case of XAU/USD, the pair dipped below $2,600 but bounced back above it, currently struggling to extend its gains.
The US Bureau of Labor Statistics reported that the CPI rose at an annualized pace of 2.6% in October and was up by 0.2% on a monthly basis, matching expectations. The core annual figure printed at 3.3%, which was also in line with the forecast. The US Dollar ticked lower as an immediate reaction to the news but resumed its advance as US indexes quickly trimmed pre-opening gains.
At the time of writing, however, market participants are battling to establish a trend. The USD retains its strength, but the momentum eased, while US indexes pared the bleeding, with only the Nasdaq Composite trading in the red. The macroeconomic excitement will likely recede as the US has no other relevant figure to release for the rest of the week.
XAU/USD short-term technical outlook
XAU/USD trades at its lowest in two months in the $2,580 region and is technically poised to extend its slump. The daily chart shows the pair remains above 100 and 200 bullish moving averages, albeit the 20 Simple Moving Average (SMA) gains downward traction above the current level. Technical indicators, in the meantime, head firmly south within negative levels. The 100 SMA provides support at around $2,540.65.
In the near term, and according to the 4-hour chart, XAU/USD downward momentum remains strong. The intraday high was set below a firmly bearish 20 SMA, which extends its slope below the longer moving averages. Finally, technical indicators turned sharply lower after correcting oversold conditions, anticipating another leg south.
Support levels: 2,572.45 2,560.65, 2,545.20
Resistance levels: 2,600.10 2,612.60, 2,627.10
Information on these pages contains forward-looking statements that involve risks and uncertainties. Markets and instruments profiled on this page are for informational purposes only and should not in any way come across as a recommendation to buy or sell in these assets. You should do your own thorough research before making any investment decisions. FXStreet does not in any way guarantee that this information is free from mistakes, errors, or material misstatements. It also does not guarantee that this information is of a timely nature. Investing in Open Markets involves a great deal of risk, including the loss of all or a portion of your investment, as well as emotional distress. All risks, losses and costs associated with investing, including total loss of principal, are your responsibility. The views and opinions expressed in this article are those of the authors and do not necessarily reflect the official policy or position of FXStreet nor its advertisers.