Gold, Chart of the Week: XAUUSD bulls pushing up against key resistances ahead of US CPI
Premium|
You have reached your limit of 5 free articles for this month.
Get all exclusive analysis, access our analysis and get Gold and signals alerts
Elevate your trading Journey.
UPGRADE- Gold is at a crossroads ahead of the US CPI event.
- Bulls look to fully test the commitments of the bears.
Gold rose to the highest in nearly three weeks on Friday despite a better-than-expected rise in US jobs in October. Counterintuitively, US bond yields and the US dollar fell even as the data likely firms the Federal Reserve's determination to slow the economy as inflation stays high. The Fed on Wednesday set its target interest rate another 75 basis points higher to a range between 3.75% and 4.00%. Chair Jerome Powell said later at a press conference that it was "very premature" to think about slowing the pace of monetary tightening.
However, investors' risk appetite was running reasonably high on Friday, following signals from China that the government could relax some of its stringent restrictions around COVID. ''Following this Friday's massive gold and commodity rally, driven by speculation China will moderate COVID restrictions and somewhat mixed payrolls, we look for specs to again grow the shorts they covered at the end of this week,'' analysts at TD Securities said.
''At $1,680/oz, the yellow metal is at a technical point that may easily see a sharp reversal. Indeed, with inflation still a big problem and the US economy running hot, rates on the front end will continue to rise, and the dollar will be firm, which prompts us to think that a correction is on the cards starting in the not-too-distant future.''
Meanwhile, the charts see the price pressured in a firm downtrend and there are prospects of a bull correction to fully test the bear's commitments ahead of the US Consumer Price Index data for the forthcoming week.
Gold weekly charts
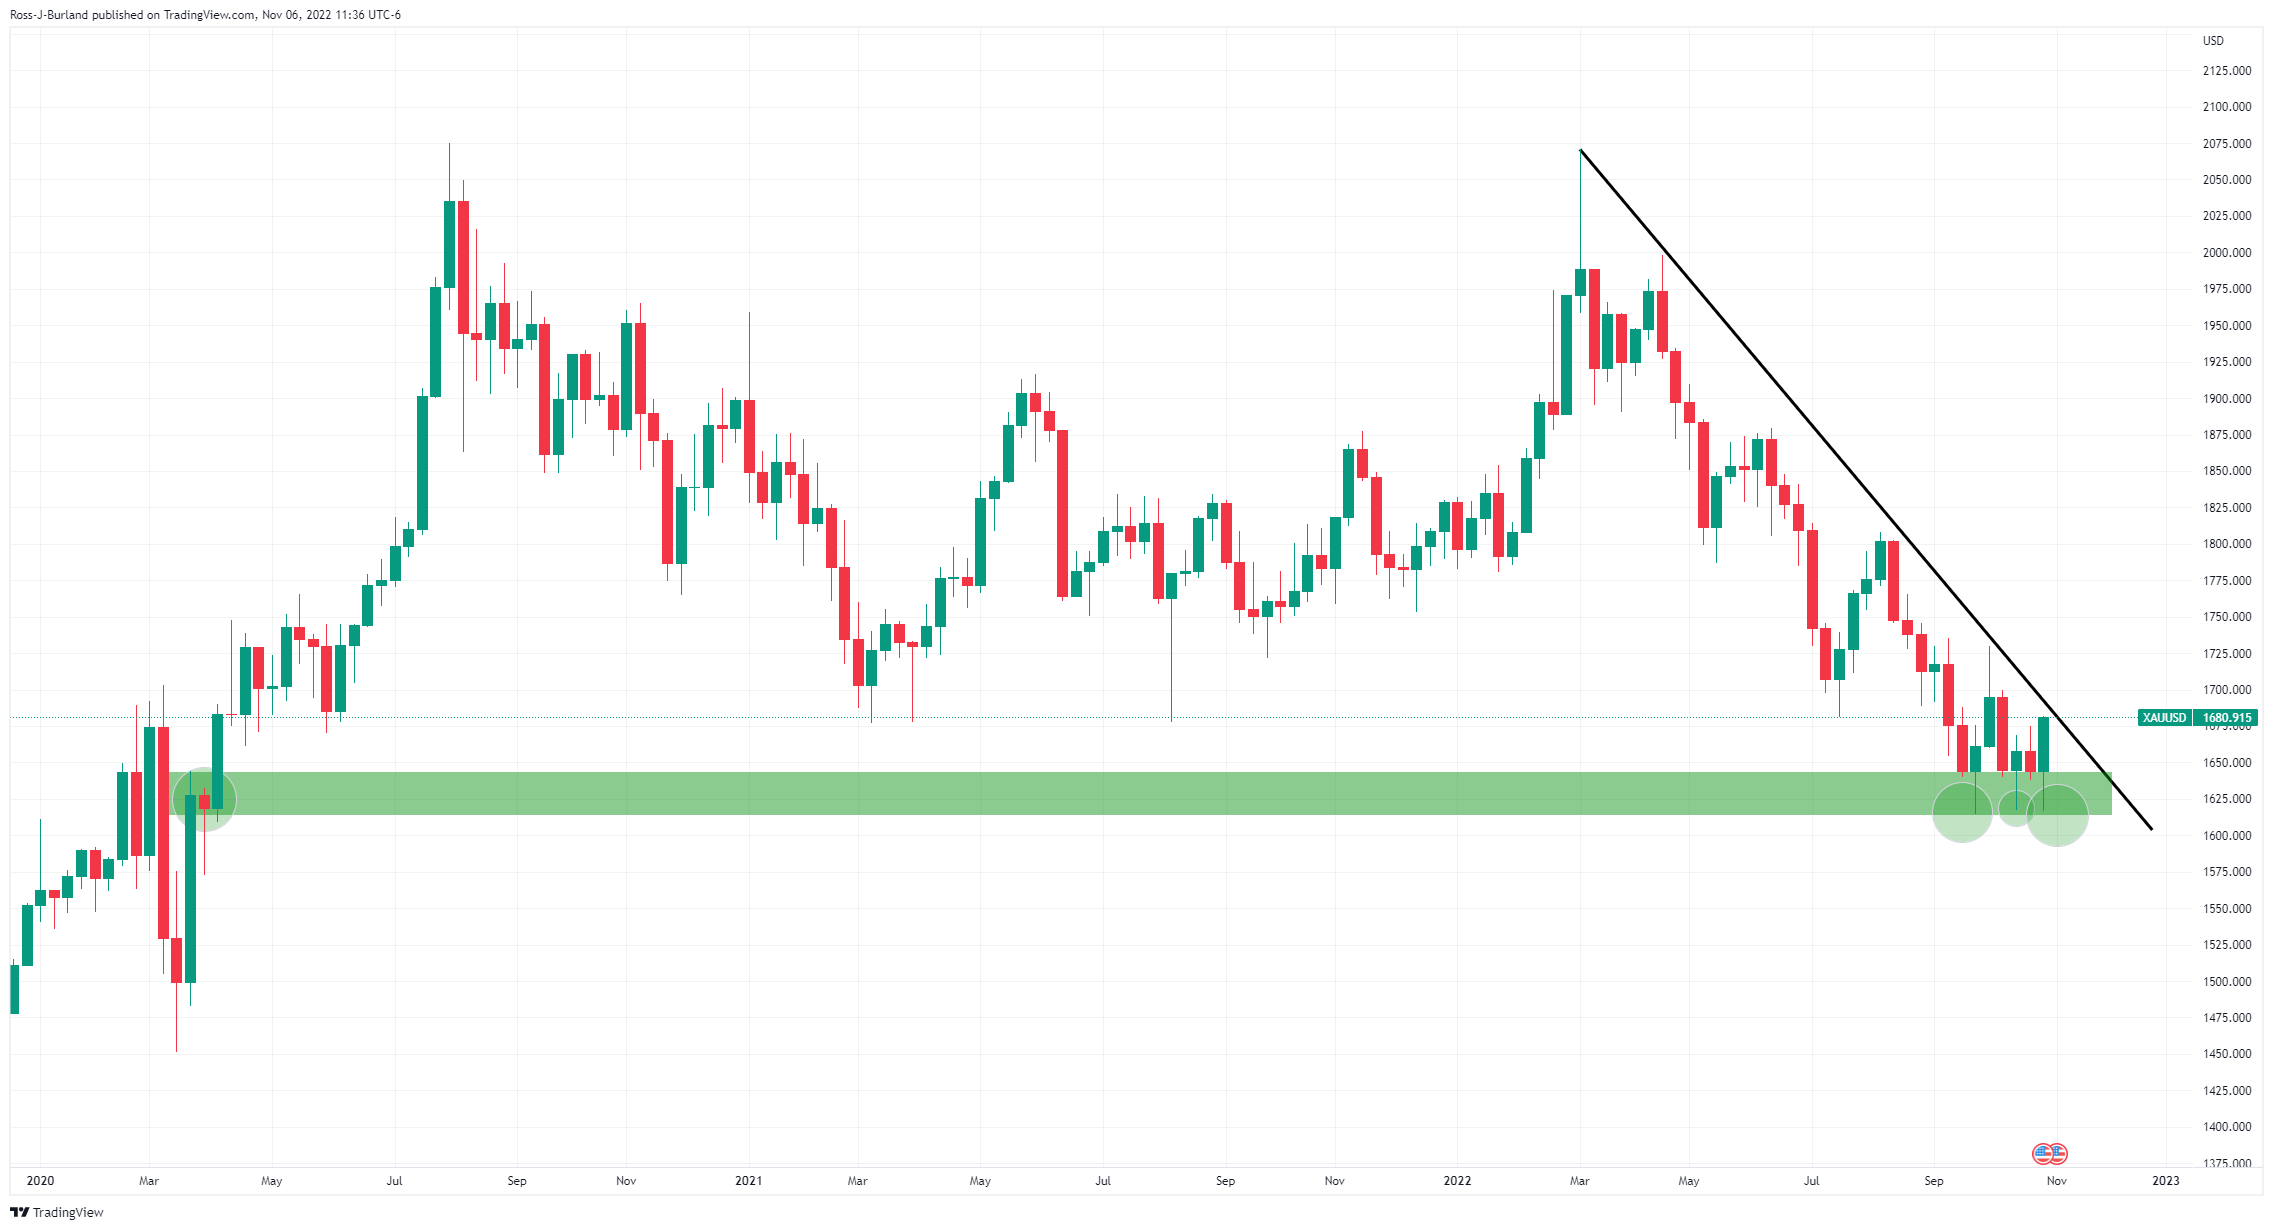
The price is accumulating at a prior structure in three weekly bottoms.
That W-formation looks menacing for the week ahead with prospects of a push into the trendline and when coupled with the following Crab harmonic pattern on the daily chart:
Gold daily charts
The price slid out of a micro trendline and is now accumulating on the backside which opens risks of a move higher.
Gold H1 chart
The last leg of the W-formation is overextended giving rise to the risks of a correction prior to a sizeable push to the upside again.
- Gold is at a crossroads ahead of the US CPI event.
- Bulls look to fully test the commitments of the bears.
Gold rose to the highest in nearly three weeks on Friday despite a better-than-expected rise in US jobs in October. Counterintuitively, US bond yields and the US dollar fell even as the data likely firms the Federal Reserve's determination to slow the economy as inflation stays high. The Fed on Wednesday set its target interest rate another 75 basis points higher to a range between 3.75% and 4.00%. Chair Jerome Powell said later at a press conference that it was "very premature" to think about slowing the pace of monetary tightening.
However, investors' risk appetite was running reasonably high on Friday, following signals from China that the government could relax some of its stringent restrictions around COVID. ''Following this Friday's massive gold and commodity rally, driven by speculation China will moderate COVID restrictions and somewhat mixed payrolls, we look for specs to again grow the shorts they covered at the end of this week,'' analysts at TD Securities said.
''At $1,680/oz, the yellow metal is at a technical point that may easily see a sharp reversal. Indeed, with inflation still a big problem and the US economy running hot, rates on the front end will continue to rise, and the dollar will be firm, which prompts us to think that a correction is on the cards starting in the not-too-distant future.''
Meanwhile, the charts see the price pressured in a firm downtrend and there are prospects of a bull correction to fully test the bear's commitments ahead of the US Consumer Price Index data for the forthcoming week.
Gold weekly charts
The price is accumulating at a prior structure in three weekly bottoms.
That W-formation looks menacing for the week ahead with prospects of a push into the trendline and when coupled with the following Crab harmonic pattern on the daily chart:
Gold daily charts
The price slid out of a micro trendline and is now accumulating on the backside which opens risks of a move higher.
Gold H1 chart
The last leg of the W-formation is overextended giving rise to the risks of a correction prior to a sizeable push to the upside again.
Information on these pages contains forward-looking statements that involve risks and uncertainties. Markets and instruments profiled on this page are for informational purposes only and should not in any way come across as a recommendation to buy or sell in these assets. You should do your own thorough research before making any investment decisions. FXStreet does not in any way guarantee that this information is free from mistakes, errors, or material misstatements. It also does not guarantee that this information is of a timely nature. Investing in Open Markets involves a great deal of risk, including the loss of all or a portion of your investment, as well as emotional distress. All risks, losses and costs associated with investing, including total loss of principal, are your responsibility. The views and opinions expressed in this article are those of the authors and do not necessarily reflect the official policy or position of FXStreet nor its advertisers.
