EUR/USD Price Forecast: Gearing up for a busy couple of weeks
Premium|
Take advantage of 50% OFF on your first month.
Start your subscription and get access to all our original articles.
You have reached your limit of 5 free articles for this month.
Get all exclusive analysis, access our analysis and get Gold and signals alerts
Elevate your trading Journey.
UPGRADEEUR/USD Current price: 1.0823
- First-tier events in the second half of the week grant market caution.
- Looming US elections and Federal Reserve decision also weigh on the mood.
- EUR/USD retains modest intraday gains, bullish potential still limited.
The EUR/USD pair revert early losses and trades in the green on Monday, comfortable above the 1.0800 mark amid a better market mood. The US Dollar gapped higher at the weekly opening but quickly changed course, extending its slump during European trading hours.
Investors are taking clues from weaker Oil Prices. The black gold edged lower after a massive Israel attack on Iranian military installations did not affect the oil industry in the country. Relief on the matter is also helping stocks maintain the green.
Still, movements will likely remain limited across the FX board as the macroeconomic calendar will be packed in the second half of the week. Germany, the Eurozone and the United States (US) will be releasing the preliminary estimates of their respective Q3 Gross Domestic Product (GDP). Even further, the three economies will publish inflation updates, while the US calendar will be filled with employment-related figures ahead of the Nonfarm Payrolls (NFP) report to be out on Friday. Meanwhile, the US elections and the Federal Reserve (Fed) monetary policy meeting will take place next week, granting caution ahead of all these major events.
So far, the macroeconomic calendar has nothing to offer. The US will release after Wall Street’s opening October Dallas Fed Manufacturing Business Index, while European Central Bank (ECB) Vice President Luis de Guindos will be on the wires.
EUR/USD short-term technical outlook
The daily chart for the EUR/USD pair shows it trimmed most of its Friday’s losses, but the bullish potential remains well-limited. The pair trades below 1.0866, the 23.6% Fibonacci retracement of the daily slump measured between 1.1208 and 1.0760.
In the same chart, the pair develops below all its moving averages, with the 20 Simple Moving Average (SMA) heading south almost vertically after crossing below a flat 100 SMA. At the same time, the SMA approaches a directionless 200 SMA, which converges with the aforementioned Fibonacci level, reinforcing its relevance. Finally, technical indicators remain well below their midlines, suggesting buying interest is still tepid.
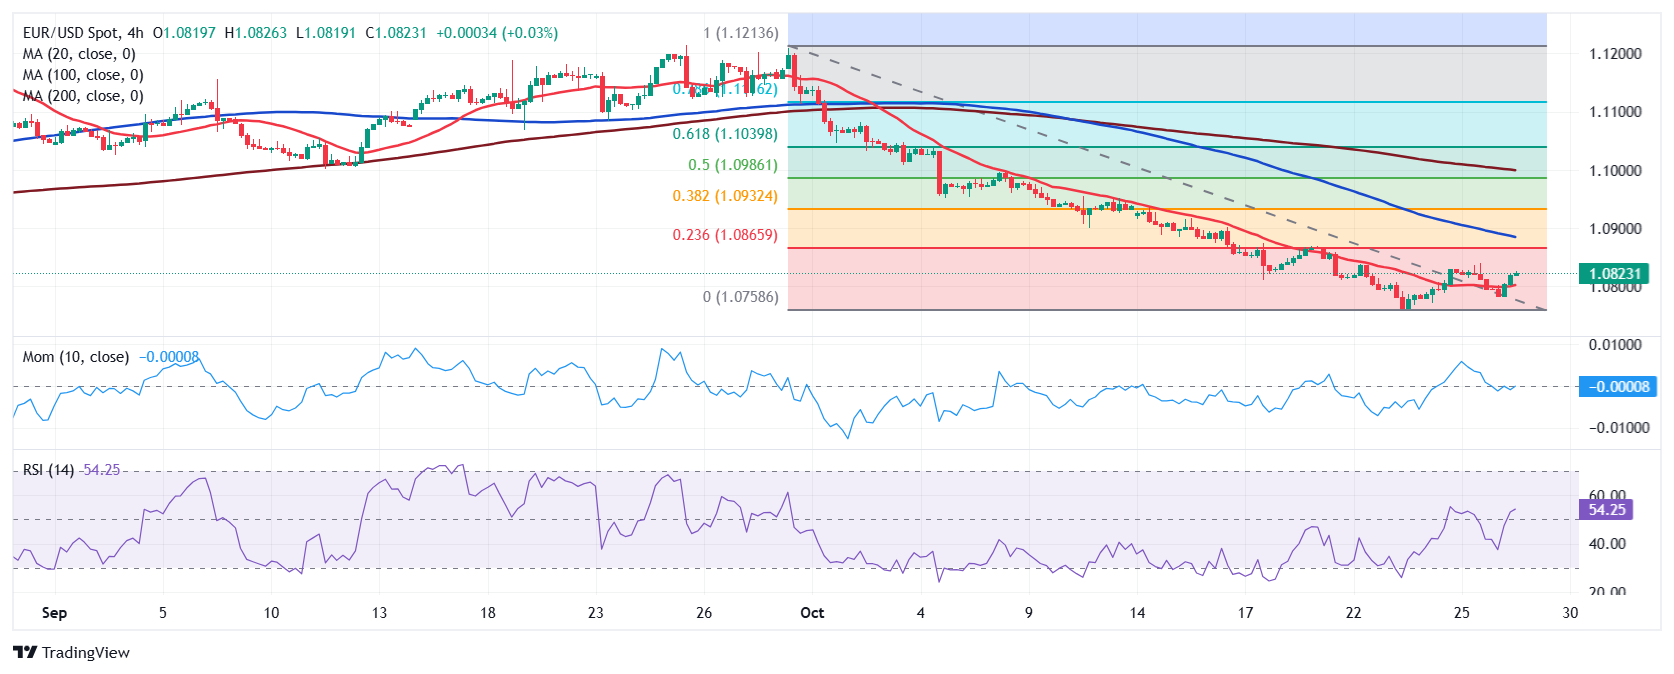
In the near term, and according to the 4-hour chart, EUR/USD is currently trading above a flat 20 SMA, but the 100 and 200 SMAs keep heading firmly lower far above the shorter one, reflecting sellers’ dominance. At the same time, the Momentum indicator aims marginally higher, just above its 100 line, while the Relative Strength Index (RSI) indicator advances modestly at around 54. The positive tone of technical indicators, however, is not enough to support a sustained recovery in the near term.
Support levels: 1.0800 1.0755 1.0710
Resistance levels: 1.0865 1.0900 1.0945
EUR/USD Current price: 1.0823
- First-tier events in the second half of the week grant market caution.
- Looming US elections and Federal Reserve decision also weigh on the mood.
- EUR/USD retains modest intraday gains, bullish potential still limited.
The EUR/USD pair revert early losses and trades in the green on Monday, comfortable above the 1.0800 mark amid a better market mood. The US Dollar gapped higher at the weekly opening but quickly changed course, extending its slump during European trading hours.
Investors are taking clues from weaker Oil Prices. The black gold edged lower after a massive Israel attack on Iranian military installations did not affect the oil industry in the country. Relief on the matter is also helping stocks maintain the green.
Still, movements will likely remain limited across the FX board as the macroeconomic calendar will be packed in the second half of the week. Germany, the Eurozone and the United States (US) will be releasing the preliminary estimates of their respective Q3 Gross Domestic Product (GDP). Even further, the three economies will publish inflation updates, while the US calendar will be filled with employment-related figures ahead of the Nonfarm Payrolls (NFP) report to be out on Friday. Meanwhile, the US elections and the Federal Reserve (Fed) monetary policy meeting will take place next week, granting caution ahead of all these major events.
So far, the macroeconomic calendar has nothing to offer. The US will release after Wall Street’s opening October Dallas Fed Manufacturing Business Index, while European Central Bank (ECB) Vice President Luis de Guindos will be on the wires.
EUR/USD short-term technical outlook
The daily chart for the EUR/USD pair shows it trimmed most of its Friday’s losses, but the bullish potential remains well-limited. The pair trades below 1.0866, the 23.6% Fibonacci retracement of the daily slump measured between 1.1208 and 1.0760.
In the same chart, the pair develops below all its moving averages, with the 20 Simple Moving Average (SMA) heading south almost vertically after crossing below a flat 100 SMA. At the same time, the SMA approaches a directionless 200 SMA, which converges with the aforementioned Fibonacci level, reinforcing its relevance. Finally, technical indicators remain well below their midlines, suggesting buying interest is still tepid.
In the near term, and according to the 4-hour chart, EUR/USD is currently trading above a flat 20 SMA, but the 100 and 200 SMAs keep heading firmly lower far above the shorter one, reflecting sellers’ dominance. At the same time, the Momentum indicator aims marginally higher, just above its 100 line, while the Relative Strength Index (RSI) indicator advances modestly at around 54. The positive tone of technical indicators, however, is not enough to support a sustained recovery in the near term.
Support levels: 1.0800 1.0755 1.0710
Resistance levels: 1.0865 1.0900 1.0945
Information on these pages contains forward-looking statements that involve risks and uncertainties. Markets and instruments profiled on this page are for informational purposes only and should not in any way come across as a recommendation to buy or sell in these assets. You should do your own thorough research before making any investment decisions. FXStreet does not in any way guarantee that this information is free from mistakes, errors, or material misstatements. It also does not guarantee that this information is of a timely nature. Investing in Open Markets involves a great deal of risk, including the loss of all or a portion of your investment, as well as emotional distress. All risks, losses and costs associated with investing, including total loss of principal, are your responsibility. The views and opinions expressed in this article are those of the authors and do not necessarily reflect the official policy or position of FXStreet nor its advertisers.