EUR/USD Price Forecast: A test of 1.0800 should not be ruled out
Premium|
Take advantage of 50% OFF on your first month.
50% OFF and access to ALL our articles and insights.
You have reached your limit of 5 free articles for this month.
Take advantage of the Special Price just for today!
50% OFF and access to ALL our articles and insights.
Subscribe to Premium- EUR/USD weakened further and broke below the key 200-day SMA.
- The US Dollar picked up extra pace and advanced to fresh multi-week tops.
- The EC’s interest rate decision and US Retail Sales are next of note.
EUR/USD extended its decline on Wednesday, hitting fresh two-month lows near 1.0860 and breaking below the key 200-day Simple Moving Average (SMA) at 1.0872.
At the same time, the U.S. Dollar continued to strengthen, pushing the U.S. Dollar Index (DXY) to revisit levels above 103.50, last seen in early August, even as U.S. yields eased across different maturities.
The dollar's rally over recent weeks was supported by the Federal Open Market Committee (FOMC) minutes from its September 18 meeting, which revealed that a "substantial majority" of policymakers favoured a 50-basis-point cut to ease monetary policy. However, they did not commit to a specific timeline for future cuts.
That said, the recent strength of the Greenback was also supported by the cautious tone from Federal Reserve (Fed) officials. However, while many policymakers are leaning toward a 25-basis-point cut next month, there are also dissenting voices like FOMC Governor Michelle Bowman and Atlanta Fed President Raphael Bostic, who have suggested the Fed might skip a cut in November.
In addition, San Francisco Fed President Mary Daly reiterated that "one or two cuts" seemed appropriate, given the more balanced state of the US economy.
Meanwhile, the CME Group’s FedWatch Tool shows that markets are pricing in an 94% probability of a 25-basis-point cut next month.
In Europe, the European Central Bank (ECB) is widely expected to reduce its policy rates by 25 basis points at its meeting on October 17.
Eurozone inflation, measured by the Harmonized Index of Consumer Prices (HICP), dropped to 1.8% year-over-year in September, below the ECB's target. Combined with stagnant GDP growth, this has further strengthened the case for additional ECB rate cuts.
As both the Fed and ECB weigh their next moves, the outlook for EUR/USD will depend on macroeconomic trends. The US economy is expected to outperform the Eurozone, which could further boost the USD.
EUR/USD daily chart
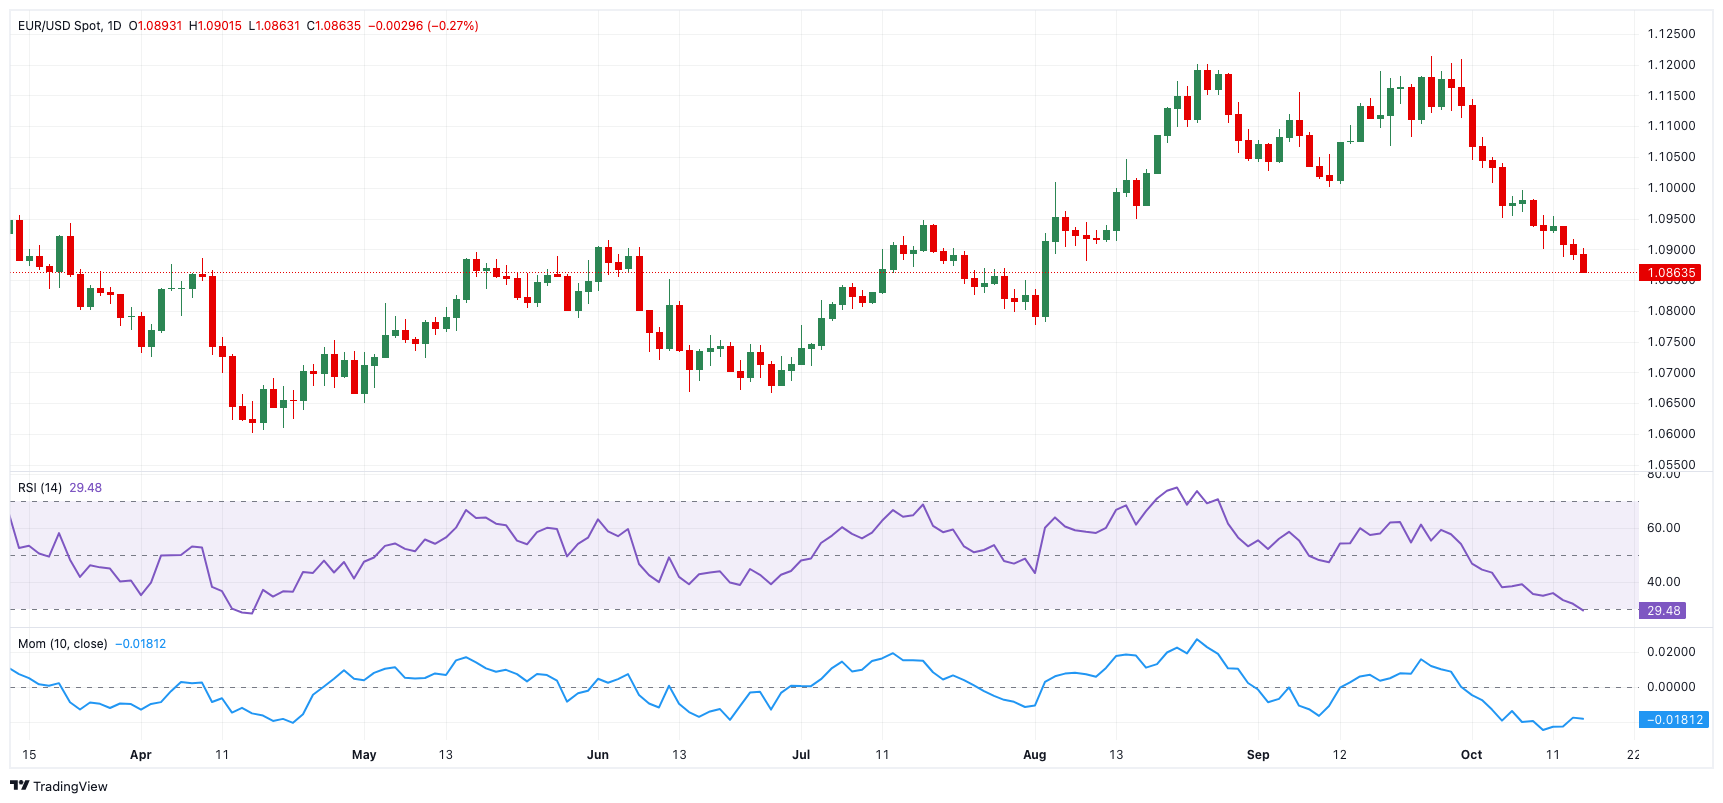
EUR/USD short-term technical outlook
Further drops might send the EUR/USD to its October low of 1.0862 (October 16), ahead of the round level of 1.0800 and seconded by the August low of 1.0777 (August 1).
On the upside, there are interim hurdles at the 100-day and 55-day SMAs at 1.0935 and 1.1040, respectively. Further up should emerge the 2024 high of 1.1214 (September 25), followed by the 2023 high of 1.1275 (July 18).
Meanwhile, the pair's outlook could shift to bearish on a sustained breakdown of the critical 200-day SMA of 1.0872.
The four-hour chart currently indicates a deteriorating downward trend. Against this, early support is at 1.0862, prior to 1.0777. On the upside, there is interim hurdle at the 55-SMA at 1.0943 ahead of 1.0996 and the 100-SMA of 1.1025. The relative strength index (RSI) hovered around 30.
- EUR/USD weakened further and broke below the key 200-day SMA.
- The US Dollar picked up extra pace and advanced to fresh multi-week tops.
- The EC’s interest rate decision and US Retail Sales are next of note.
EUR/USD extended its decline on Wednesday, hitting fresh two-month lows near 1.0860 and breaking below the key 200-day Simple Moving Average (SMA) at 1.0872.
At the same time, the U.S. Dollar continued to strengthen, pushing the U.S. Dollar Index (DXY) to revisit levels above 103.50, last seen in early August, even as U.S. yields eased across different maturities.
The dollar's rally over recent weeks was supported by the Federal Open Market Committee (FOMC) minutes from its September 18 meeting, which revealed that a "substantial majority" of policymakers favoured a 50-basis-point cut to ease monetary policy. However, they did not commit to a specific timeline for future cuts.
That said, the recent strength of the Greenback was also supported by the cautious tone from Federal Reserve (Fed) officials. However, while many policymakers are leaning toward a 25-basis-point cut next month, there are also dissenting voices like FOMC Governor Michelle Bowman and Atlanta Fed President Raphael Bostic, who have suggested the Fed might skip a cut in November.
In addition, San Francisco Fed President Mary Daly reiterated that "one or two cuts" seemed appropriate, given the more balanced state of the US economy.
Meanwhile, the CME Group’s FedWatch Tool shows that markets are pricing in an 94% probability of a 25-basis-point cut next month.
In Europe, the European Central Bank (ECB) is widely expected to reduce its policy rates by 25 basis points at its meeting on October 17.
Eurozone inflation, measured by the Harmonized Index of Consumer Prices (HICP), dropped to 1.8% year-over-year in September, below the ECB's target. Combined with stagnant GDP growth, this has further strengthened the case for additional ECB rate cuts.
As both the Fed and ECB weigh their next moves, the outlook for EUR/USD will depend on macroeconomic trends. The US economy is expected to outperform the Eurozone, which could further boost the USD.
EUR/USD daily chart
EUR/USD short-term technical outlook
Further drops might send the EUR/USD to its October low of 1.0862 (October 16), ahead of the round level of 1.0800 and seconded by the August low of 1.0777 (August 1).
On the upside, there are interim hurdles at the 100-day and 55-day SMAs at 1.0935 and 1.1040, respectively. Further up should emerge the 2024 high of 1.1214 (September 25), followed by the 2023 high of 1.1275 (July 18).
Meanwhile, the pair's outlook could shift to bearish on a sustained breakdown of the critical 200-day SMA of 1.0872.
The four-hour chart currently indicates a deteriorating downward trend. Against this, early support is at 1.0862, prior to 1.0777. On the upside, there is interim hurdle at the 55-SMA at 1.0943 ahead of 1.0996 and the 100-SMA of 1.1025. The relative strength index (RSI) hovered around 30.
Information on these pages contains forward-looking statements that involve risks and uncertainties. Markets and instruments profiled on this page are for informational purposes only and should not in any way come across as a recommendation to buy or sell in these assets. You should do your own thorough research before making any investment decisions. FXStreet does not in any way guarantee that this information is free from mistakes, errors, or material misstatements. It also does not guarantee that this information is of a timely nature. Investing in Open Markets involves a great deal of risk, including the loss of all or a portion of your investment, as well as emotional distress. All risks, losses and costs associated with investing, including total loss of principal, are your responsibility. The views and opinions expressed in this article are those of the authors and do not necessarily reflect the official policy or position of FXStreet nor its advertisers.