EUR/USD Forecast: The 1.0900 region caps the upside so far
Premium|
Take advantage of 50% OFF on your first month.
Start your subscription and get access to all our original articles.
You have reached your limit of 5 free articles for this month.
Get all exclusive analysis, access our analysis and get Gold and signals alerts
Elevate your trading Journey.
UPGRADE- EUR/USD flirted with monthly highs around 1.0890.
- The Greenback lost further impetus along with US yields.
- The US ISM Manufacturing PMI disappointed expectations in May.
The US Dollar (USD) traded defensively at the beginning of the week, providing extra wings to the risk-associated universe and encouraging EUR/USD to add to its ongoing recovery and approach the key 1.0900 barrier.
The pair rebounded and advanced for the third straight day due to an accelerating downward trend in the Greenback and an equally marked drop in US yields across the spectrum.
Meanwhile, speculation that the Federal Reserve (Fed) might maintain its restrictive stance longer than expected continued to rise, supported by recent hawkish comments from Fed officials. However, Monday’s pale prints of the US ISM Manufacturing seem to have tilted the scales to a probable reduction of rates in November.
Indeed, according to the CME Group’s FedWatch Tool, there is a nearly 73% probability of lower interest rates by the November 7 meeting.
Regarding the European Central Bank (ECB), a rate cut at the imminent June 6 meeting is vox populi, despite May’s higher inflation figures in Germany and the broader euro area. Doubts persist, however, when it comes to factor in potential cuts beyond the summer.
Looking ahead, the incipient recovery in some economic fundamentals in the Eurozone, coupled with the loss of momentum of the US economy, reinforce the narrowing of the gap between the Fed and the ECB monetary policy, therefore favouring the rebound in EUR/USD.
However, in the longer run, given the rising likelihood of the ECB reducing rates before the Fed, the potential for further weakness in EUR/USD should be considered in the next few months.
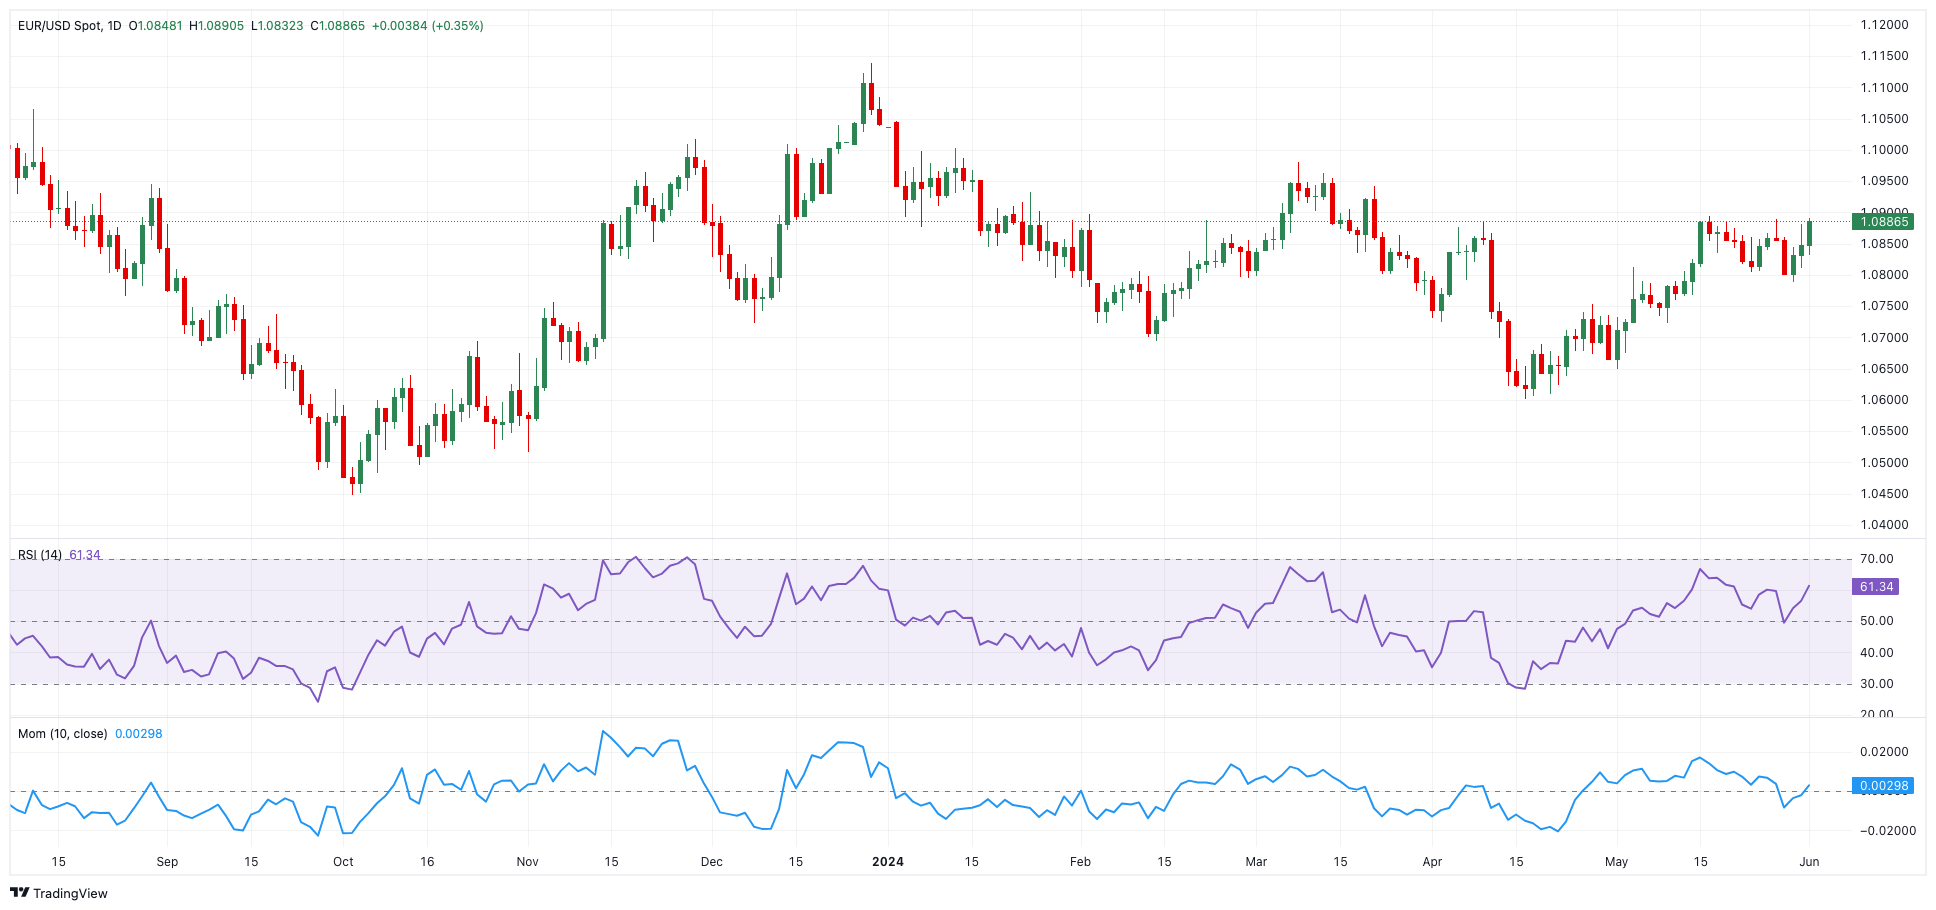
EUR/USD daily chart
EUR/USD short-term technical outlook
If bulls maintain control, EUR/USD may confront the May high of 1.0894 (May 16), followed by the March top of 1.0981 (March 8) and the weekly peak of 1.0998 (January 11), all before hitting the critical 1.1000 level.
The resumption of the bearish tone, on the other hand, may send the pair to the weekly low of 1.0788 (May 30), an area underpinned by the 200-day SMA. The loss of this region could drag spot to the May low of 1.0649 (May 1), prior to the 2024 bottom of 1.0601 (April 16) and the November 2023 low of 1.0516 (November 1). Once this zone is breached, the pair may go for the weekly low of 1.0495 (October 13, 2023), the 2023 bottom of 1.0448 (October 3), and the 1.0400 round milestone.
So far, the 4-hour chart indicates a strong return. The 55-SMA at 1.0845 is the next upward obstacle, followed by 1.0894 and 1.0942. Looking south, 1.0788 is first, followed by 1.0766 and the 200-SMA at 1.0760. The relative strength index (RSI) rose over 50.
- EUR/USD flirted with monthly highs around 1.0890.
- The Greenback lost further impetus along with US yields.
- The US ISM Manufacturing PMI disappointed expectations in May.
The US Dollar (USD) traded defensively at the beginning of the week, providing extra wings to the risk-associated universe and encouraging EUR/USD to add to its ongoing recovery and approach the key 1.0900 barrier.
The pair rebounded and advanced for the third straight day due to an accelerating downward trend in the Greenback and an equally marked drop in US yields across the spectrum.
Meanwhile, speculation that the Federal Reserve (Fed) might maintain its restrictive stance longer than expected continued to rise, supported by recent hawkish comments from Fed officials. However, Monday’s pale prints of the US ISM Manufacturing seem to have tilted the scales to a probable reduction of rates in November.
Indeed, according to the CME Group’s FedWatch Tool, there is a nearly 73% probability of lower interest rates by the November 7 meeting.
Regarding the European Central Bank (ECB), a rate cut at the imminent June 6 meeting is vox populi, despite May’s higher inflation figures in Germany and the broader euro area. Doubts persist, however, when it comes to factor in potential cuts beyond the summer.
Looking ahead, the incipient recovery in some economic fundamentals in the Eurozone, coupled with the loss of momentum of the US economy, reinforce the narrowing of the gap between the Fed and the ECB monetary policy, therefore favouring the rebound in EUR/USD.
However, in the longer run, given the rising likelihood of the ECB reducing rates before the Fed, the potential for further weakness in EUR/USD should be considered in the next few months.
EUR/USD daily chart
EUR/USD short-term technical outlook
If bulls maintain control, EUR/USD may confront the May high of 1.0894 (May 16), followed by the March top of 1.0981 (March 8) and the weekly peak of 1.0998 (January 11), all before hitting the critical 1.1000 level.
The resumption of the bearish tone, on the other hand, may send the pair to the weekly low of 1.0788 (May 30), an area underpinned by the 200-day SMA. The loss of this region could drag spot to the May low of 1.0649 (May 1), prior to the 2024 bottom of 1.0601 (April 16) and the November 2023 low of 1.0516 (November 1). Once this zone is breached, the pair may go for the weekly low of 1.0495 (October 13, 2023), the 2023 bottom of 1.0448 (October 3), and the 1.0400 round milestone.
So far, the 4-hour chart indicates a strong return. The 55-SMA at 1.0845 is the next upward obstacle, followed by 1.0894 and 1.0942. Looking south, 1.0788 is first, followed by 1.0766 and the 200-SMA at 1.0760. The relative strength index (RSI) rose over 50.
Information on these pages contains forward-looking statements that involve risks and uncertainties. Markets and instruments profiled on this page are for informational purposes only and should not in any way come across as a recommendation to buy or sell in these assets. You should do your own thorough research before making any investment decisions. FXStreet does not in any way guarantee that this information is free from mistakes, errors, or material misstatements. It also does not guarantee that this information is of a timely nature. Investing in Open Markets involves a great deal of risk, including the loss of all or a portion of your investment, as well as emotional distress. All risks, losses and costs associated with investing, including total loss of principal, are your responsibility. The views and opinions expressed in this article are those of the authors and do not necessarily reflect the official policy or position of FXStreet nor its advertisers.