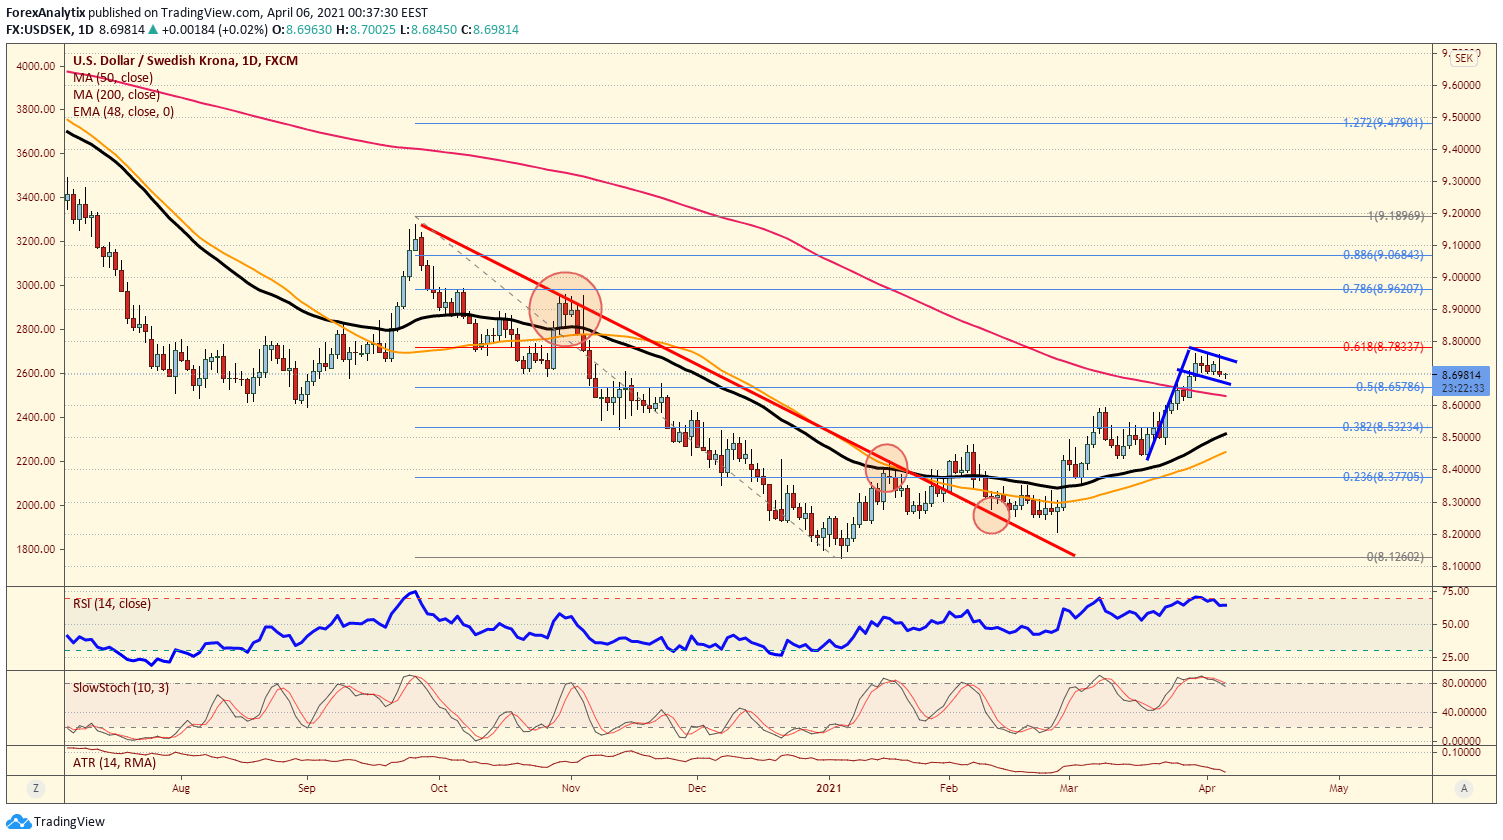
Chart of the day: USD/SEK
|On March 1st, our "Chart of the Day" was the USD/SEK and we were looking for a break higher towards the 200dma back then. Well, we got that move (and some) and now this bullish move looks set to make another move higher near term. As long as we hold above the 200dma the risk may be for a breakout above the 61.8% Fibonacci retracement level at the 8.7833 level to target closer to the 9.000 level and the 78% retracement. RSI is working off being overbought and looks set to make another move higher.
Information on these pages contains forward-looking statements that involve risks and uncertainties. Markets and instruments profiled on this page are for informational purposes only and should not in any way come across as a recommendation to buy or sell in these assets. You should do your own thorough research before making any investment decisions. FXStreet does not in any way guarantee that this information is free from mistakes, errors, or material misstatements. It also does not guarantee that this information is of a timely nature. Investing in Open Markets involves a great deal of risk, including the loss of all or a portion of your investment, as well as emotional distress. All risks, losses and costs associated with investing, including total loss of principal, are your responsibility. The views and opinions expressed in this article are those of the authors and do not necessarily reflect the official policy or position of FXStreet nor its advertisers.