AUD/USD Price Forecast: Defends 100-day SMA as focus remains on US inflation data this week
Premium|
Take advantage of 50% OFF on your first month.
Start your subscription and get access to all our original articles.
You have reached your limit of 5 free articles for this month.
Get all exclusive analysis, access our analysis and get Gold and signals alerts
Elevate your trading Journey.
UPGRADE- AUD/USD rebounds from over a three-week low/100-day SMA tested earlier this Tuesday.
- Mixed Chinese trade data and a modest USD uptick do little to hinder the modest recovery.
- The upside seems limited as traders keenly await US inflation figures due later this week.
The AUD/USD pair manages to defend the 100-day Simple Moving Average (SMA) support near the 0.6645 region and stages a modest intraday recovery from over a three-week low touched during the Asian session on Tuesday. The uptick followed the release of Chinese trade data, which showed that the country's surplus widened to CNY649.34 billion in August the CNY601.98 billion in the previous month. Further details of the report revealed that exports grew by 8.7% YoY as compared to the 6.5% rise seen in July. That said, the softer import reading fueled concerns about the poor state of domestic demand, which, along with a modest US Dollar (USD) strength, should keep a lid on any meaningful appreciating move for the currency pair.
Investors have been scaling back their expectations for a more aggressive policy easing by the Federal Reserve (Fed) following the release of mixed US monthly employment details last Friday. According to the CME Group's FedWatch tool, traders see a 71% chance of a 25-basis-points (bps) rate cut at the next FOMC meeting on September 17-18 and only a 29% chance of a 50-bp reduction. This, in turn, pushes the USD Index (DXY), which tracks the Greenback against a basket of currencies, back closer to the monthly peak touched last week and should act as a headwind for the AUD/USD pair. Traders might also prefer to wait for the release of the latest US inflation figures for cues about the Fed's rate-cut path before placing fresh directional bets.
The crucial US Consumer Price Index (CPI) report is due on Wednesday, which will be followed by the Producer Price Index (PPI) on Thursday. Softer-than-expected inflation numbers would raise hopes for a 50 bps rate cut in September and attract fresh USD selling. In contrast, the market reaction to stronger inflation print is more likely to be limited amid the prospects for an imminent start of the Fed's rate-cutting cycle. This, in turn, might hold back the USD bulls from placing fresh bets, which, along with the Reserve Bank of Australia's (RBA) hawkish stance, suggests that the AUD/USD pair's recent corrective decline from the YTD peak touched in August has run its course.
Technical Outlook
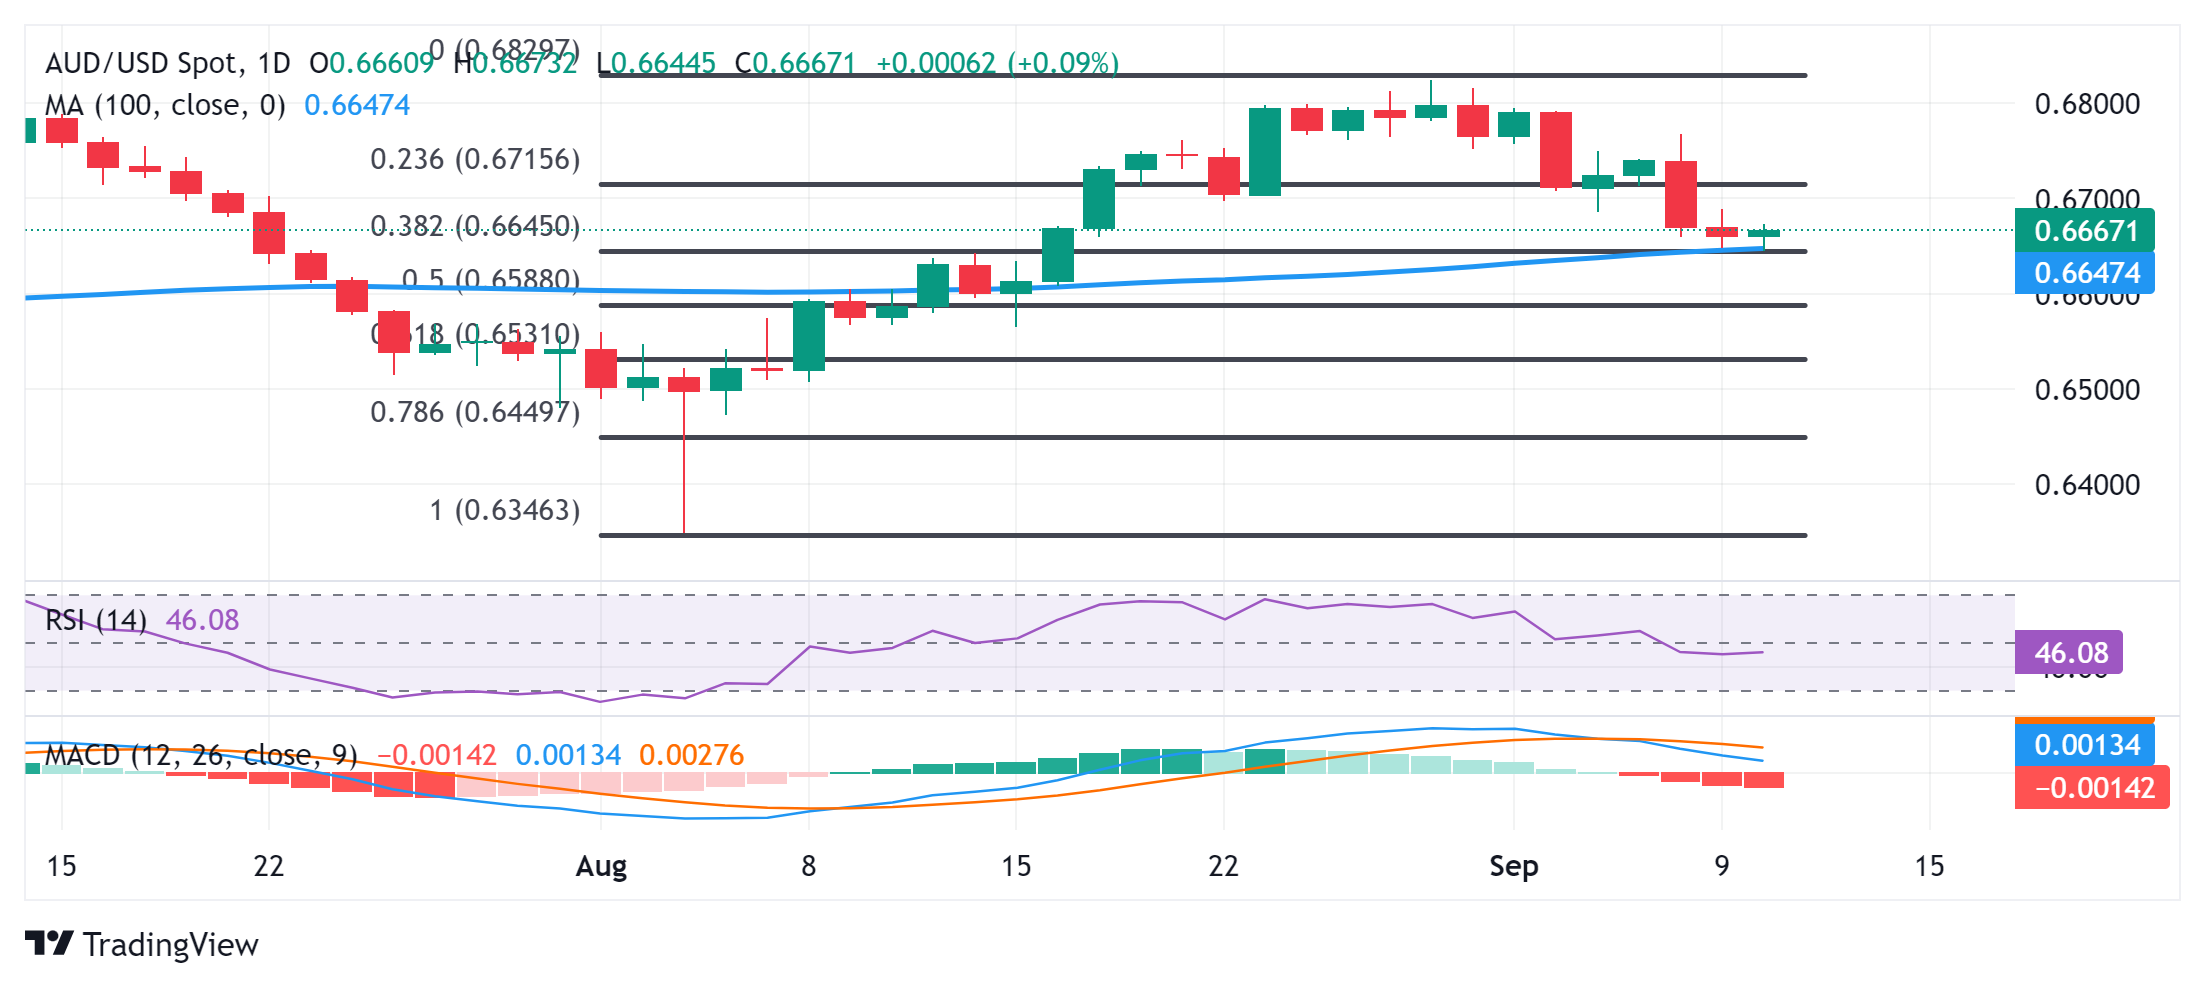
From a technical perspective, the 100-day SMA coincides with the 38.2% Fibonacci retracement level of a strong recovery from the YTD low touched in August and should act as a key pivotal point. Given that oscillators on the daily chart have just started gaining negative traction, a convincing breakthrough will prompt aggressive technical selling and pave the way for deeper losses. The AUD/USD pair might then accelerate the fall towards testing sub-0.6600 levels or the 50% Fibo. level. Some follow-through selling could expose the 61.8% Fibo. level, around the 0.6530 region, before spot prices eventually drop to the 0.6500 psychological mark.
On the flip side, the 0.6700 mark is likely to act as an immediate strong hurdle ahead of the 0.6715 region, or the 23.6% Fibo. support breakpoint. A sustained strength beyond will be seen as a fresh trigger for bullish traders and lift the AUD/USD pair toward the 0.6765 intermediate hurdle en route to the 0.6800 round figure and the YTD peak, around the 0.6825 region.
AUD/USD daily chart
- AUD/USD rebounds from over a three-week low/100-day SMA tested earlier this Tuesday.
- Mixed Chinese trade data and a modest USD uptick do little to hinder the modest recovery.
- The upside seems limited as traders keenly await US inflation figures due later this week.
The AUD/USD pair manages to defend the 100-day Simple Moving Average (SMA) support near the 0.6645 region and stages a modest intraday recovery from over a three-week low touched during the Asian session on Tuesday. The uptick followed the release of Chinese trade data, which showed that the country's surplus widened to CNY649.34 billion in August the CNY601.98 billion in the previous month. Further details of the report revealed that exports grew by 8.7% YoY as compared to the 6.5% rise seen in July. That said, the softer import reading fueled concerns about the poor state of domestic demand, which, along with a modest US Dollar (USD) strength, should keep a lid on any meaningful appreciating move for the currency pair.
Investors have been scaling back their expectations for a more aggressive policy easing by the Federal Reserve (Fed) following the release of mixed US monthly employment details last Friday. According to the CME Group's FedWatch tool, traders see a 71% chance of a 25-basis-points (bps) rate cut at the next FOMC meeting on September 17-18 and only a 29% chance of a 50-bp reduction. This, in turn, pushes the USD Index (DXY), which tracks the Greenback against a basket of currencies, back closer to the monthly peak touched last week and should act as a headwind for the AUD/USD pair. Traders might also prefer to wait for the release of the latest US inflation figures for cues about the Fed's rate-cut path before placing fresh directional bets.
The crucial US Consumer Price Index (CPI) report is due on Wednesday, which will be followed by the Producer Price Index (PPI) on Thursday. Softer-than-expected inflation numbers would raise hopes for a 50 bps rate cut in September and attract fresh USD selling. In contrast, the market reaction to stronger inflation print is more likely to be limited amid the prospects for an imminent start of the Fed's rate-cutting cycle. This, in turn, might hold back the USD bulls from placing fresh bets, which, along with the Reserve Bank of Australia's (RBA) hawkish stance, suggests that the AUD/USD pair's recent corrective decline from the YTD peak touched in August has run its course.
Technical Outlook
From a technical perspective, the 100-day SMA coincides with the 38.2% Fibonacci retracement level of a strong recovery from the YTD low touched in August and should act as a key pivotal point. Given that oscillators on the daily chart have just started gaining negative traction, a convincing breakthrough will prompt aggressive technical selling and pave the way for deeper losses. The AUD/USD pair might then accelerate the fall towards testing sub-0.6600 levels or the 50% Fibo. level. Some follow-through selling could expose the 61.8% Fibo. level, around the 0.6530 region, before spot prices eventually drop to the 0.6500 psychological mark.
On the flip side, the 0.6700 mark is likely to act as an immediate strong hurdle ahead of the 0.6715 region, or the 23.6% Fibo. support breakpoint. A sustained strength beyond will be seen as a fresh trigger for bullish traders and lift the AUD/USD pair toward the 0.6765 intermediate hurdle en route to the 0.6800 round figure and the YTD peak, around the 0.6825 region.
AUD/USD daily chart
Information on these pages contains forward-looking statements that involve risks and uncertainties. Markets and instruments profiled on this page are for informational purposes only and should not in any way come across as a recommendation to buy or sell in these assets. You should do your own thorough research before making any investment decisions. FXStreet does not in any way guarantee that this information is free from mistakes, errors, or material misstatements. It also does not guarantee that this information is of a timely nature. Investing in Open Markets involves a great deal of risk, including the loss of all or a portion of your investment, as well as emotional distress. All risks, losses and costs associated with investing, including total loss of principal, are your responsibility. The views and opinions expressed in this article are those of the authors and do not necessarily reflect the official policy or position of FXStreet nor its advertisers.