AUD/USD Forecast: Corrective decline could extend to 0.6650
Premium|
Take advantage of 50% OFF on your first month.
Start your subscription and get access to all our original articles.
You have reached your limit of 5 free articles for this month.
Get all exclusive analysis, access our analysis and get Gold and signals alerts
Elevate your trading Journey.
UPGRADE- AUD/USD kept a bearish tone in the first half of the week.
- Extra gains in the US Dollar weighed on the risk complex.
- The Westpac Leading Index and the RBA’s Simon are due next.
AUD/USD built on losses recorded at the beginning of the week and receded to fresh two-week lows in the 0.6715-0.6710 band on Tuesday.
The pair's second daily pullback came in tandem with further gains in the US Dollar (USD), despite declining US yields and market chatter signalling that a rate cut by the Fed in September appears almost fully priced in. Investors, therefore, continued to add to the prospects of two rate cuts by the Fed, the second one expected at the December 18 gathering.
These market expectations picked up pace after Chief Jerome Powell argued on Monday that the three US inflation readings for the second quarter "slightly increase confidence" that the rate of price rises is moving towards the Fed's target in a stable manner. For many, these comments from Powell appear to have opened the door to rate cuts sooner than previously anticipated.
On another front, extra weakness in copper prices and a marginal advance in iron ore prices accompanied Tuesday’s negative developments around the Aussie dollar.
In terms of monetary policy, it now seems that the Reserve Bank of Australia (RBA) will be the last G10 central bank to start reducing its interest rates.
At its latest meeting, the RBA maintained a hawkish stance, keeping the official cash rate at 4.35% and signalling flexibility for future decisions. The Minutes of that meeting showed that officials debated whether an additional interest rate hike was necessary to curb inflation but ultimately chose to hold steady, partly due to concerns about a potential sharp slowdown in the labour market.
The RBA is not in a hurry to ease policy, anticipating it will take time for inflation to consistently fall within the 2-3% target range. There is about a 25% chance of a rate cut in August, increasing to around 50% in the subsequent months.
Potential easing by the Fed in the medium term, in contrast to the RBA’s likely prolonged restrictive stance, could support AUD/USD in the coming months.
However, concerns about the slow momentum in the Chinese economy might hinder a sustained recovery of the Australian currency as China continues to face post-pandemic challenges. The persistent lack of traction in Chinese inflation could lead to some stimulus from the People’s Bank of China (PBoC), which might eventually support the AUD, although disappointing Q2 GDP figures should keep any enthusiasm subdued.
In terms of data, the next significant release in Australia will be the Leading Index by Westpac on July 17, followed by a speech by the RBA’s Simon.
AUD/USD daily chart
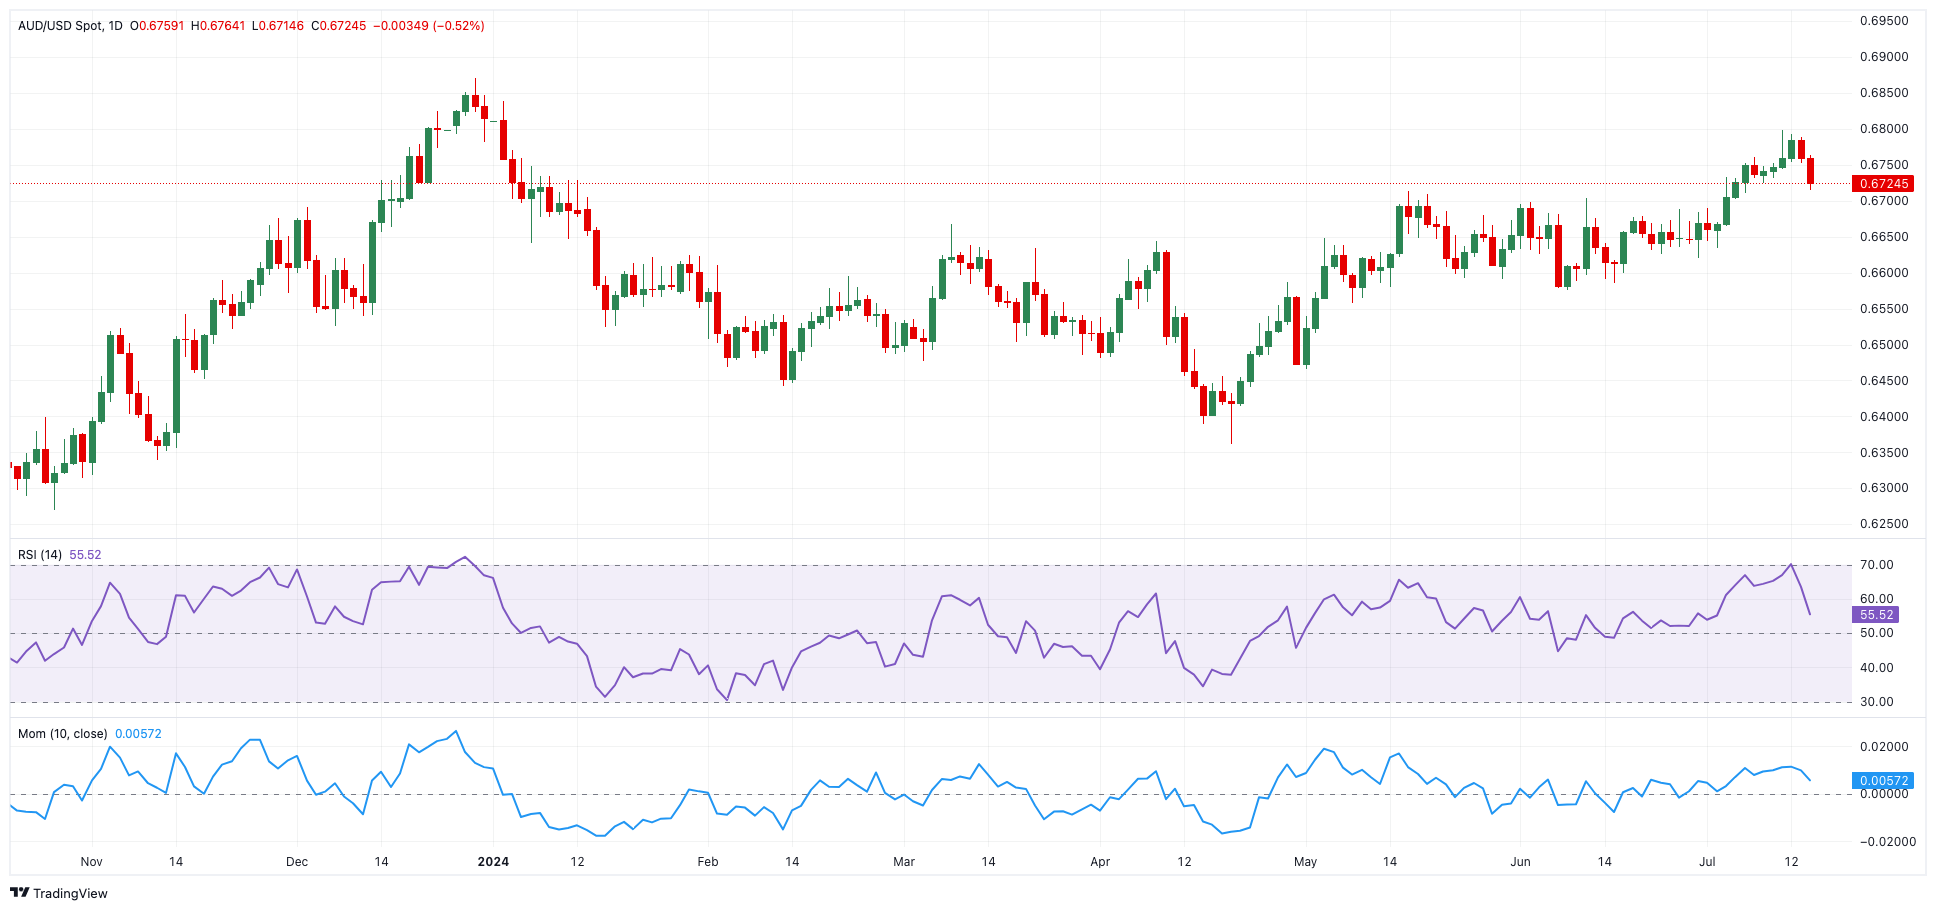
AUD/USD short-term technical outlook
The extra decline in AUD/USD should meet the next interim support at the 55-day SMA at 0.6654. If the pair clears this region, it could then embark on a potential test of the June low of 0.6574 (June 10), which appears bolstered by the key 200-day SMA (0.65735). Down from here comes the May low of 0.6465, seconded by the 2024 bottom of 0.6362 (April 19).
Bullish attempts, on the flip side, should retarget the July top of 0.6798 (July 8), ahead of the December 2023 peak of 0.6871, then the July 2023 high of 0.6894 (July 14), and the key 0.7000 barrier.
Overall, the uptrend should continue as long as the AUD/USD is trading above the 200-day SMA.
The 4-hour chart indicates a pick-up in the downward trend. Against that, the immediate target comes at 0.6714 ahead of the 100-SMA of 0.6707 and then the 200-SMA of 0.6673. On the upside, initial hurdle aligns at the 55-SMA of 0.6746 seconded by 0.6798 and 0.6871. The RSI dropped to about 36.
- AUD/USD kept a bearish tone in the first half of the week.
- Extra gains in the US Dollar weighed on the risk complex.
- The Westpac Leading Index and the RBA’s Simon are due next.
AUD/USD built on losses recorded at the beginning of the week and receded to fresh two-week lows in the 0.6715-0.6710 band on Tuesday.
The pair's second daily pullback came in tandem with further gains in the US Dollar (USD), despite declining US yields and market chatter signalling that a rate cut by the Fed in September appears almost fully priced in. Investors, therefore, continued to add to the prospects of two rate cuts by the Fed, the second one expected at the December 18 gathering.
These market expectations picked up pace after Chief Jerome Powell argued on Monday that the three US inflation readings for the second quarter "slightly increase confidence" that the rate of price rises is moving towards the Fed's target in a stable manner. For many, these comments from Powell appear to have opened the door to rate cuts sooner than previously anticipated.
On another front, extra weakness in copper prices and a marginal advance in iron ore prices accompanied Tuesday’s negative developments around the Aussie dollar.
In terms of monetary policy, it now seems that the Reserve Bank of Australia (RBA) will be the last G10 central bank to start reducing its interest rates.
At its latest meeting, the RBA maintained a hawkish stance, keeping the official cash rate at 4.35% and signalling flexibility for future decisions. The Minutes of that meeting showed that officials debated whether an additional interest rate hike was necessary to curb inflation but ultimately chose to hold steady, partly due to concerns about a potential sharp slowdown in the labour market.
The RBA is not in a hurry to ease policy, anticipating it will take time for inflation to consistently fall within the 2-3% target range. There is about a 25% chance of a rate cut in August, increasing to around 50% in the subsequent months.
Potential easing by the Fed in the medium term, in contrast to the RBA’s likely prolonged restrictive stance, could support AUD/USD in the coming months.
However, concerns about the slow momentum in the Chinese economy might hinder a sustained recovery of the Australian currency as China continues to face post-pandemic challenges. The persistent lack of traction in Chinese inflation could lead to some stimulus from the People’s Bank of China (PBoC), which might eventually support the AUD, although disappointing Q2 GDP figures should keep any enthusiasm subdued.
In terms of data, the next significant release in Australia will be the Leading Index by Westpac on July 17, followed by a speech by the RBA’s Simon.
AUD/USD daily chart
AUD/USD short-term technical outlook
The extra decline in AUD/USD should meet the next interim support at the 55-day SMA at 0.6654. If the pair clears this region, it could then embark on a potential test of the June low of 0.6574 (June 10), which appears bolstered by the key 200-day SMA (0.65735). Down from here comes the May low of 0.6465, seconded by the 2024 bottom of 0.6362 (April 19).
Bullish attempts, on the flip side, should retarget the July top of 0.6798 (July 8), ahead of the December 2023 peak of 0.6871, then the July 2023 high of 0.6894 (July 14), and the key 0.7000 barrier.
Overall, the uptrend should continue as long as the AUD/USD is trading above the 200-day SMA.
The 4-hour chart indicates a pick-up in the downward trend. Against that, the immediate target comes at 0.6714 ahead of the 100-SMA of 0.6707 and then the 200-SMA of 0.6673. On the upside, initial hurdle aligns at the 55-SMA of 0.6746 seconded by 0.6798 and 0.6871. The RSI dropped to about 36.
Information on these pages contains forward-looking statements that involve risks and uncertainties. Markets and instruments profiled on this page are for informational purposes only and should not in any way come across as a recommendation to buy or sell in these assets. You should do your own thorough research before making any investment decisions. FXStreet does not in any way guarantee that this information is free from mistakes, errors, or material misstatements. It also does not guarantee that this information is of a timely nature. Investing in Open Markets involves a great deal of risk, including the loss of all or a portion of your investment, as well as emotional distress. All risks, losses and costs associated with investing, including total loss of principal, are your responsibility. The views and opinions expressed in this article are those of the authors and do not necessarily reflect the official policy or position of FXStreet nor its advertisers.