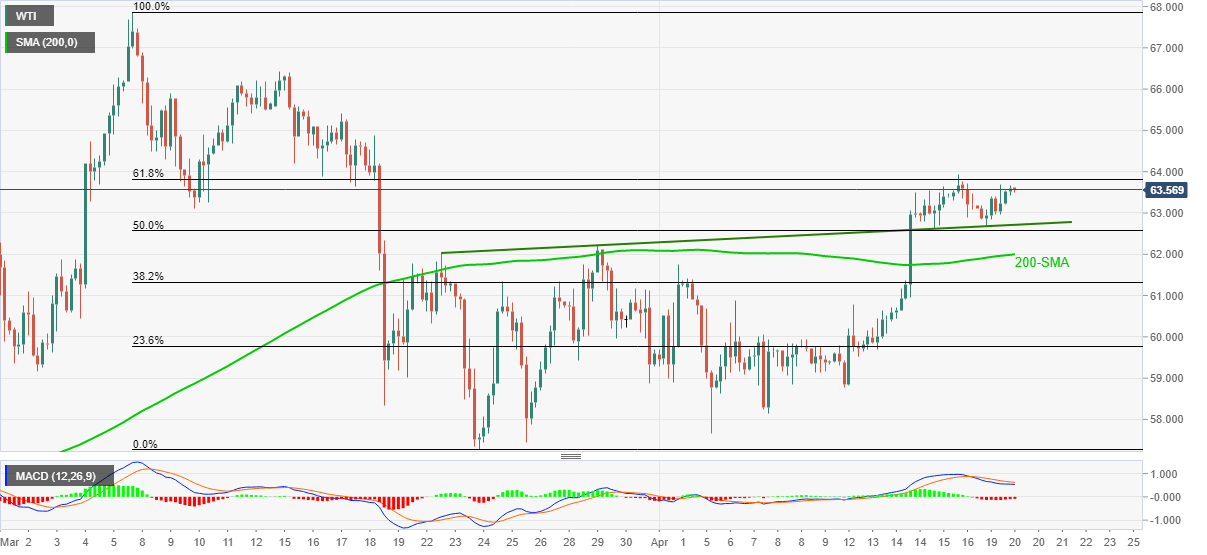
- WTI stays firmer while keeping the bounce off previous resistance line.
- Receding bearish bias of MACD, sustained trading beyond 200-SMA favor bulls.
WTI prints mild gains while picking up bids near $63.60 during Tuesday’s Asian session. The energy benchmark bounced off an ascending support line, previous resistance, from March 22 the previous day.
In doing so, the quote remains above 200-SMA amid the receding bearish bias of MACD signals.
However, a clear break above 61.8% Fibonacci retracement of March 08-23 downside, around $63.80 tests the WTI bulls off-late.
It’s worth mentioning that the black gold’s ability to stay past $63.80 needs validation from the $64.00 threshold before eyeing the March 17 top near $65.40 and the mid-March peak surrounding $66.45.
Meanwhile, pullback moves below the stated support line near $62.70 may dwindle around 50% Fibonacci retracement level of $62.55 and 200-SMA, around 62.00 by the press time.
Overall, WTI is on the bullish trajectory towards the previous month’s top near $67.85.
WTI four-hour chart
Trend: Bullish
Information on these pages contains forward-looking statements that involve risks and uncertainties. Markets and instruments profiled on this page are for informational purposes only and should not in any way come across as a recommendation to buy or sell in these assets. You should do your own thorough research before making any investment decisions. FXStreet does not in any way guarantee that this information is free from mistakes, errors, or material misstatements. It also does not guarantee that this information is of a timely nature. Investing in Open Markets involves a great deal of risk, including the loss of all or a portion of your investment, as well as emotional distress. All risks, losses and costs associated with investing, including total loss of principal, are your responsibility. The views and opinions expressed in this article are those of the authors and do not necessarily reflect the official policy or position of FXStreet nor its advertisers. The author will not be held responsible for information that is found at the end of links posted on this page.
If not otherwise explicitly mentioned in the body of the article, at the time of writing, the author has no position in any stock mentioned in this article and no business relationship with any company mentioned. The author has not received compensation for writing this article, other than from FXStreet.
FXStreet and the author do not provide personalized recommendations. The author makes no representations as to the accuracy, completeness, or suitability of this information. FXStreet and the author will not be liable for any errors, omissions or any losses, injuries or damages arising from this information and its display or use. Errors and omissions excepted.
The author and FXStreet are not registered investment advisors and nothing in this article is intended to be investment advice.
Recommended content
Editors’ Picks
EUR/USD clings to daily gains above 1.0650

EUR/USD gained traction and turned positive on the day above 1.0650. The improvement seen in risk mood following the earlier flight to safety weighs on the US Dollar ahead of the weekend and helps the pair push higher.
GBP/USD recovers toward 1.2450 after UK Retail Sales data

GBP/USD reversed its direction and advanced to the 1.2450 area after touching a fresh multi-month low below 1.2400 in the Asian session. The positive shift seen in risk mood on easing fears over a deepening Iran-Israel conflict supports the pair.
Gold holds steady at around $2,380 following earlier spike

Gold stabilized near $2,380 after spiking above $2,400 with the immediate reaction to reports of Israel striking Iran. Meanwhile, the pullback seen in the US Treasury bond yields helps XAU/USD hold its ground.
Bitcoin Weekly Forecast: BTC post-halving rally could be partially priced in Premium

Bitcoin price shows no signs of directional bias while it holds above $60,000. The fourth BTC halving is partially priced in, according to Deutsche Bank’s research.
Week ahead – US GDP and BoJ decision on top of next week’s agenda

US GDP, core PCE and PMIs the next tests for the Dollar. Investors await BoJ for guidance about next rate hike. EU and UK PMIs, as well as Australian CPIs also on tap.