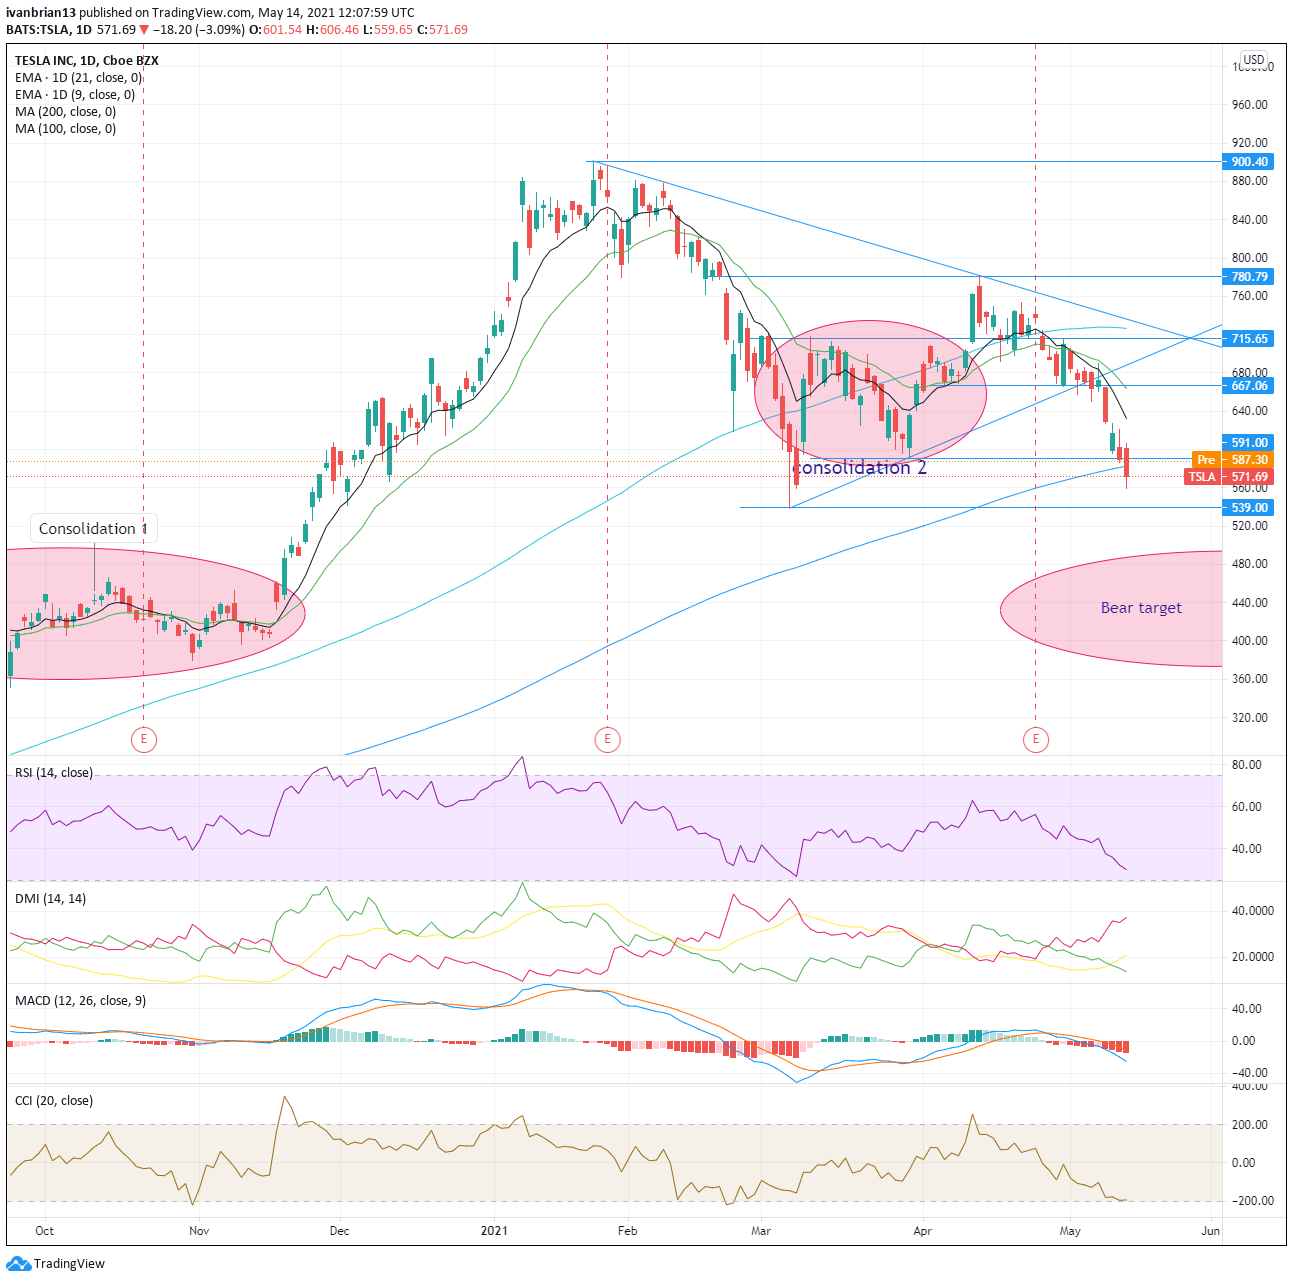
- TSLA shares remain on course for sub-$500.
- Big tech all bounce as AAPL leads.
- AAPL nearly holds 200-day support.
The bounce looked predictable in the end, but then hindsight is always 20-20. Big tech and Apple, in particular, led the indices higher. Some key big tech names had retraced to pretty decent support levels so the bounce for them should not be too surprising. Tesla though remains the name under the most pressure. Today sees futures higher in the premarket, but can the FAANGT round out the week in the green?
Anyway, let us dig in and see if the charts hold anything for us to make some money.
Facebook (FB) stock forecast
A higher low on Thursday may be an initial bullish sign, but it is pretty early. It traded up and stopped at the confluence of the 9 and 21-day moving average on Thursday. This is the first resistance to overcome, the $309 region. After that, there is small resistance at $315 and $321 before testing highs at $330. The brilliant earnings release has already been taken back, as has the previous high at $285.78. Short-term trading relies on the 9 and 21-day moving averages for sentiment, and FB is below both. Breaking the $296 level and small trendline then targets the 100-day MA and 200-day MA at $276. This gets us close to our buy zone. FB consolidated here in March and took off. This should stall any more weakness, at least temporarily, and provide a good entry for speculative longs. The Relative Strength Index (RSI) and Commodity Channel Index (CCI) have given a nice combination of overbought signals, the last one being after Q1 2021 results.
| Support | 298-296 | 285.78 | 276-200 day ma | 266-256 buy zone |
| Resistance | 309-310 MA | 315 | 321.47 | 331.81 |

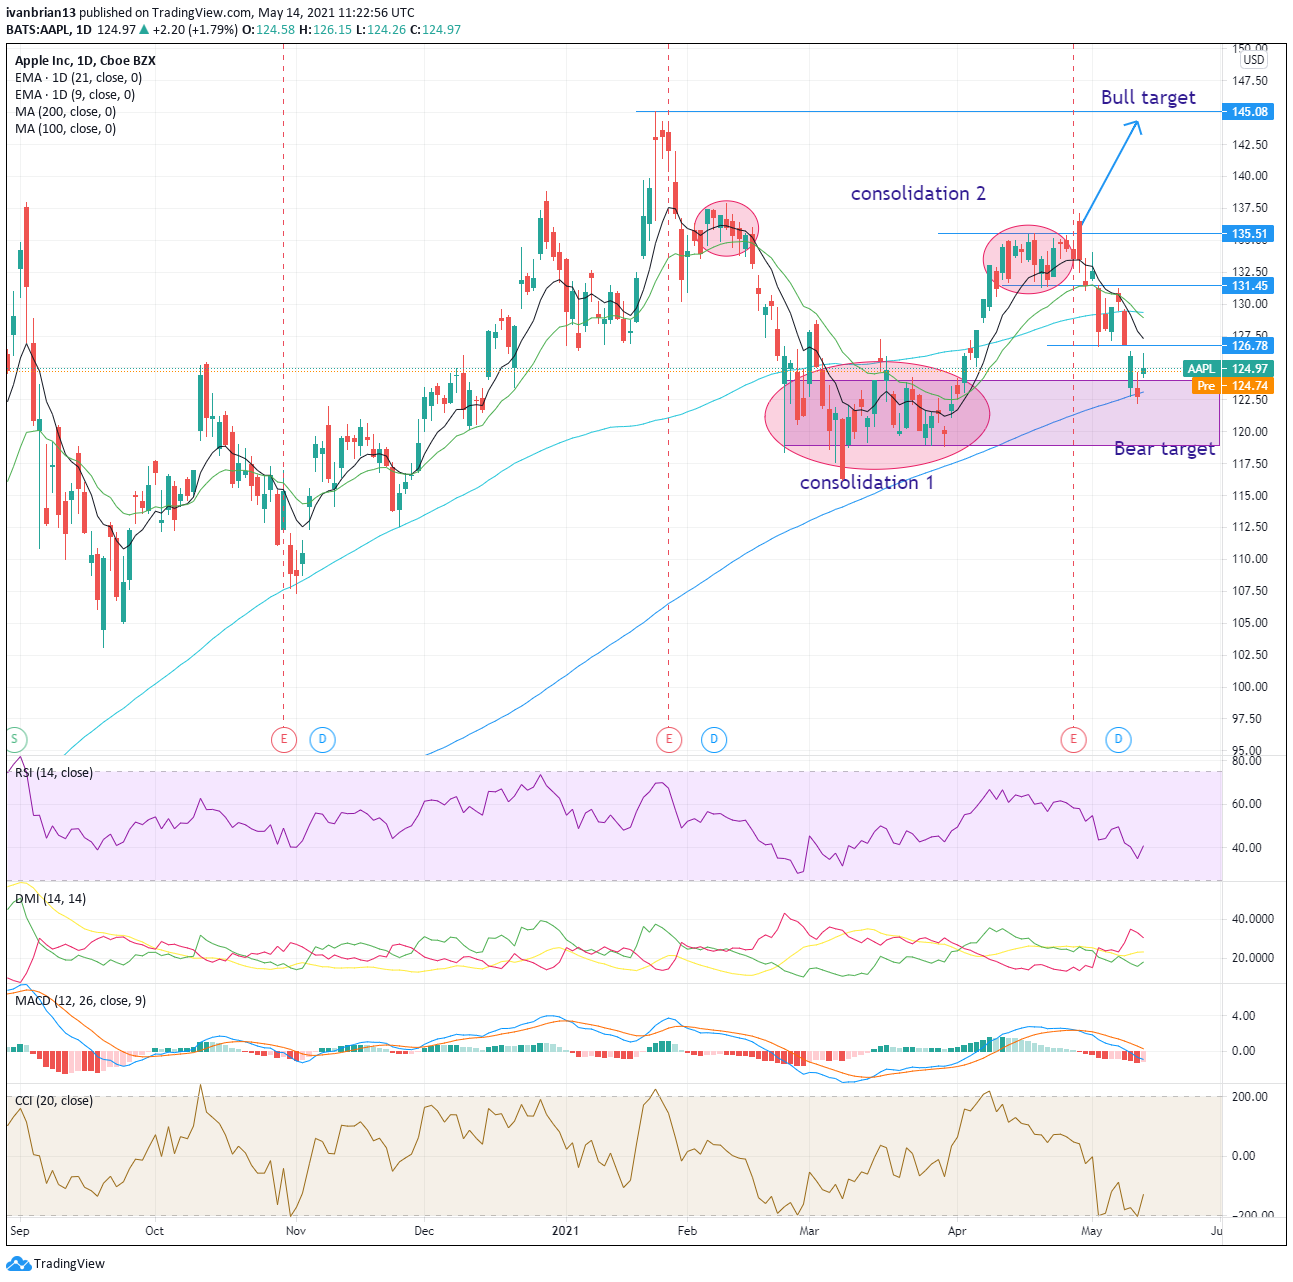
Apple (AAPL) stock forecast
A very nice bounce from the 200-day moving average. This also corresponds to the top of our consolidation 1 zone. This should always have slowed any further falls as there is a lot of price discovery here. Volume is much harder to quantify accurately these days due to the proliferation of dark pools, BATS, etc., but an area of price acceptance has a lot of time and volume. So buyers and sellers are in relative agreement that this is a value area. A confluence of levels or indicators increases the importance and strength of the level. Pushing above $126.78 and then the short-term moving averages are key to turning the trend bullish. The CCI came close to giving an oversold signal but did not. This needs to be watched as a signal with confirmation from MACD or DMI would be a potential reversal entry.
| Support | 123 | 119 pivot | 116.21 | ||
| Resistance | 126.78 | 129.40 weak | 131.45 | 135.51 | 145.08 |
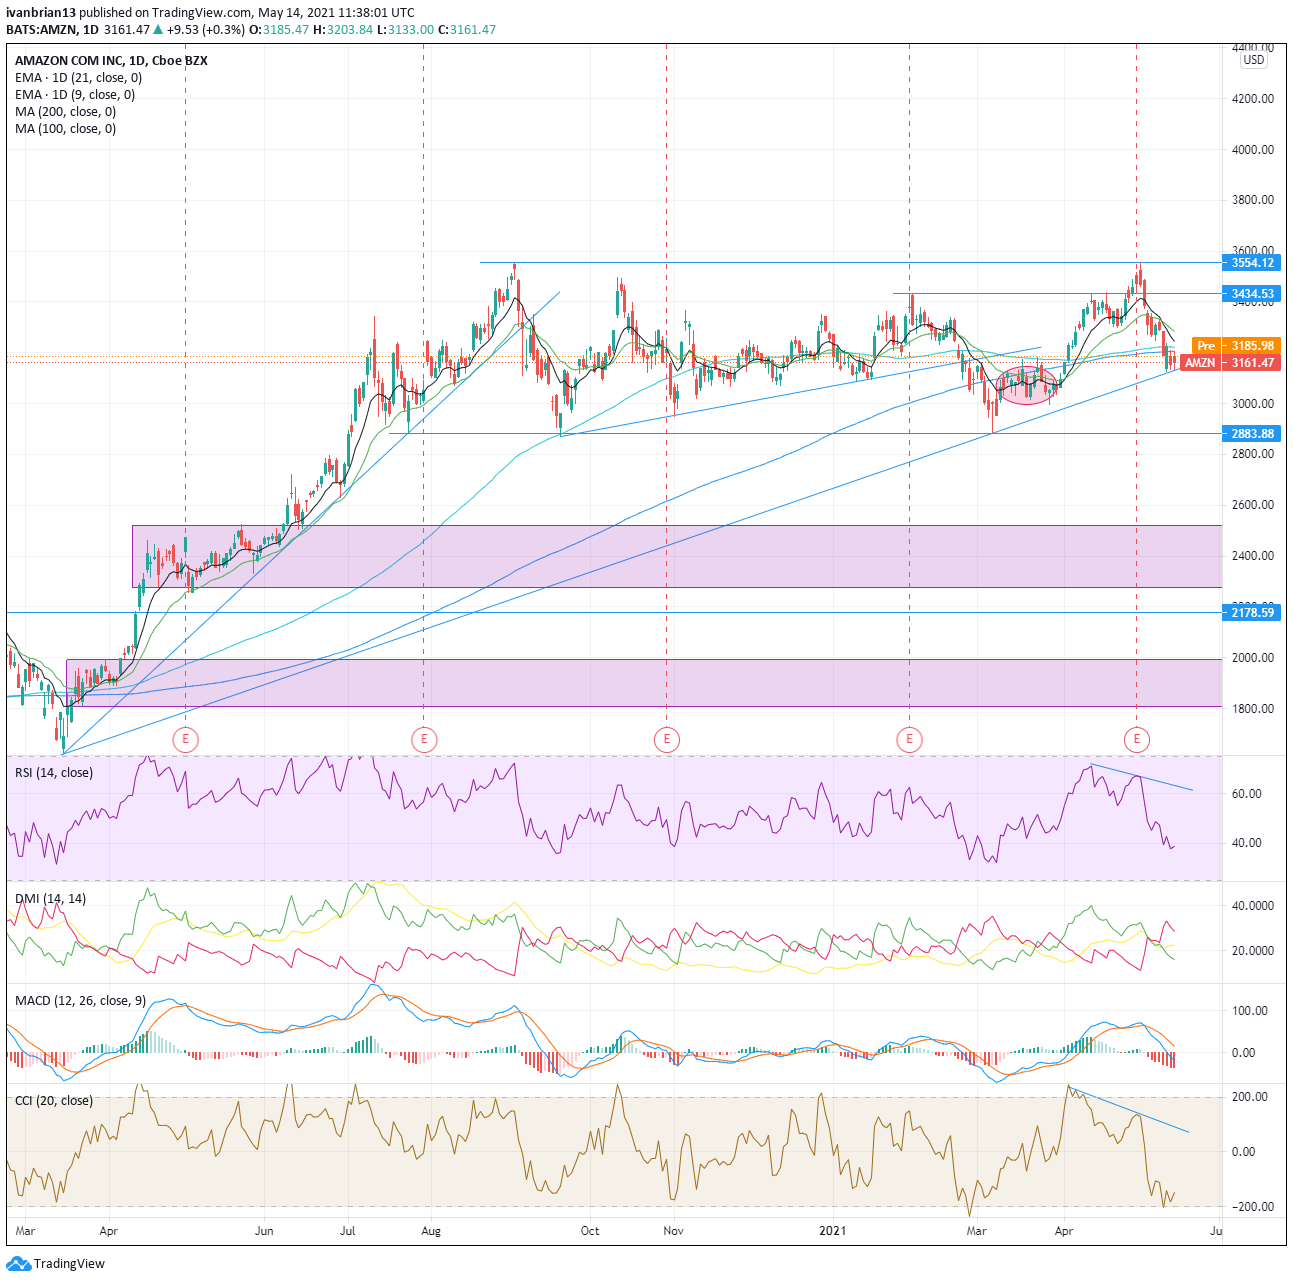
Amazon (AMZN) stock forecast
It was a pretty stable day for AMZN on Thursday as it kept holding trend line support around the $3,131 region. It has had a look three times now at breaking lower, so be on the lookout. A break here, and it could get ugly down to $2,883. A small consolidation area was highlighted at $3,080, but it is not very strong. There is very little price discovery and acceptance below $2,883, so a break could see a sharp acceleration toward the buy zone at $2,500-2300. Below that there is a strong buy zone at $1,800-2,000. This is a big consolidation area from March 2020 before the move higher. The highs at $3,555 did not see a matching high in either RSI or CCI, so this is a bearish divergence. Now AMZN has traded down to the long-term trend line in place since the March 2020 lows.
Resistance is the 200-day MA at $3,205 currently. Breaking this targets the short-term MA at $3,245 and then $3,434 before a test of new highs.
| Support | 3131 key | 3080 | 2883 | 2500 | 2300 | 2000 |
| Resistance | 3205 200 day MA | 3245 | 3434 | 3555 |
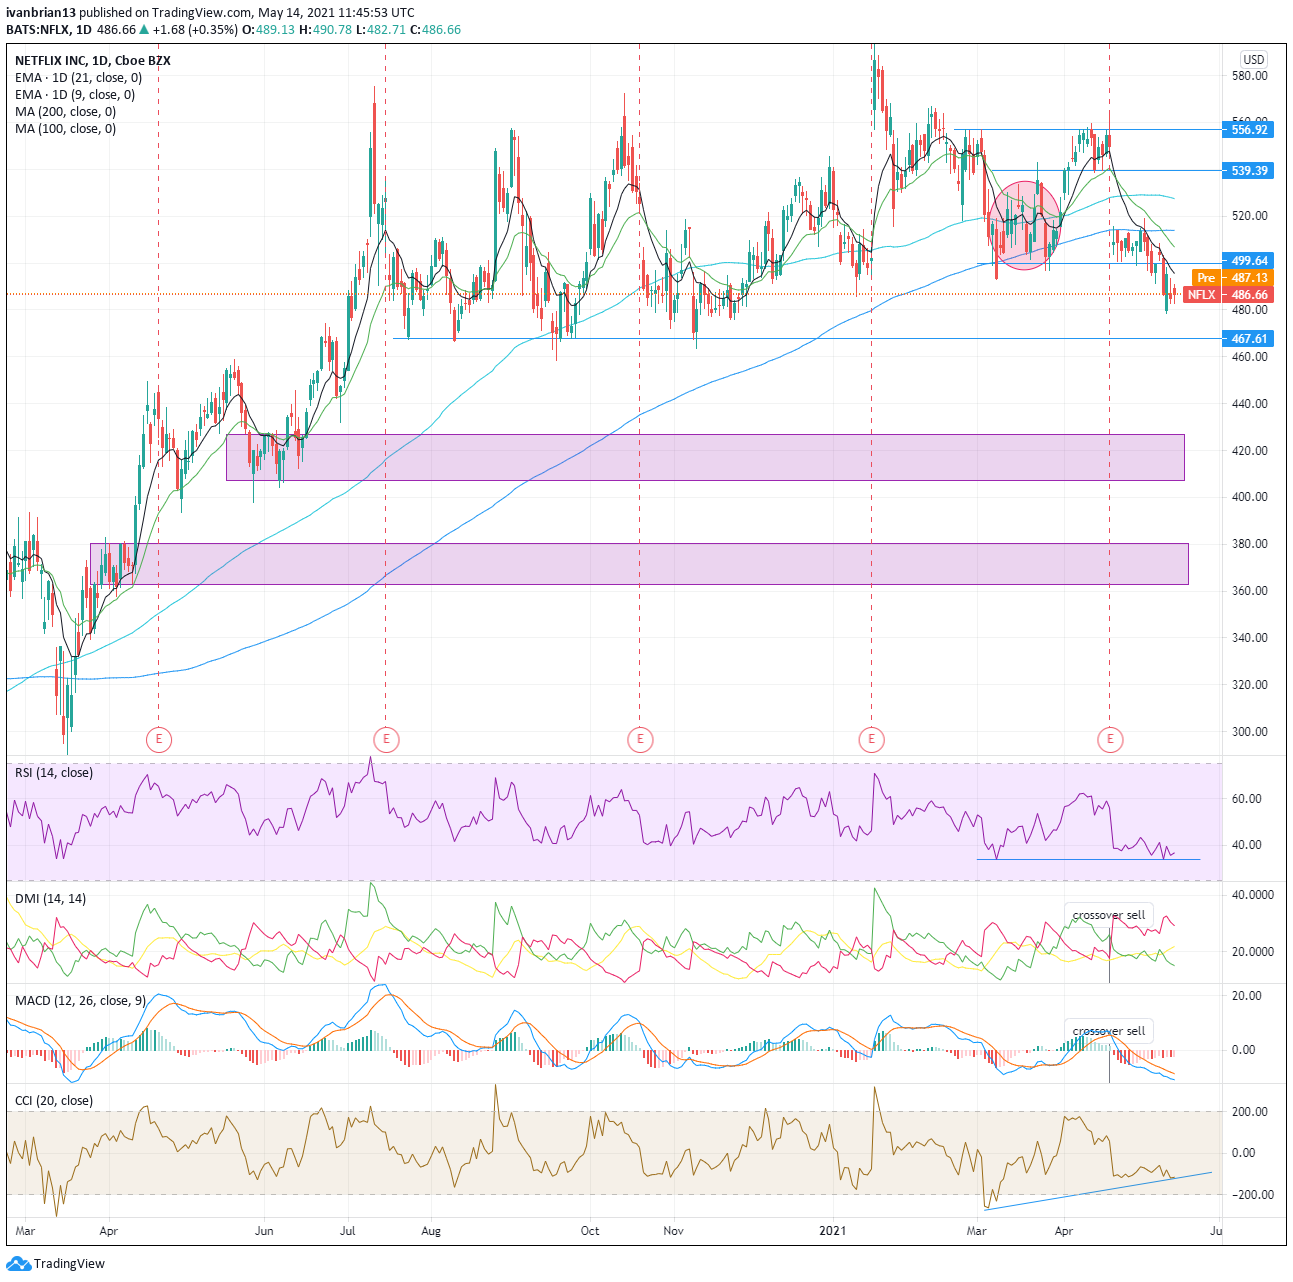
Netflix (NFLX) stock forecast
It was a quiet one for NFLX yesterday. We can see how well the highlighted consolidation area worked to hold the fall for quite some time. Consolidation areas are a representation of price and time. Generally, the longer an asset spends at a price the more accepting buyers and sellers are of that price and usually more volume too. This equates to equilibrium and no sudden moves.
Now NFLX shares have broken lower and are targetting $467. MACD and DMI are in the crossover sell range. RSI and CCI are still stable, so I would expect these to trend lower with a price move lower. A break of $467 is very negative and should see Netflix head for the $420 region. There is not a lot of price discovery below $467 until that level. $360-380 is a better and stronger buy area.
| Support | 467 | 420 | 400 | 380 | 360 | |
| Resistance | 495.55 | 514-200 day | 539 | 556.92 | 593.29 |
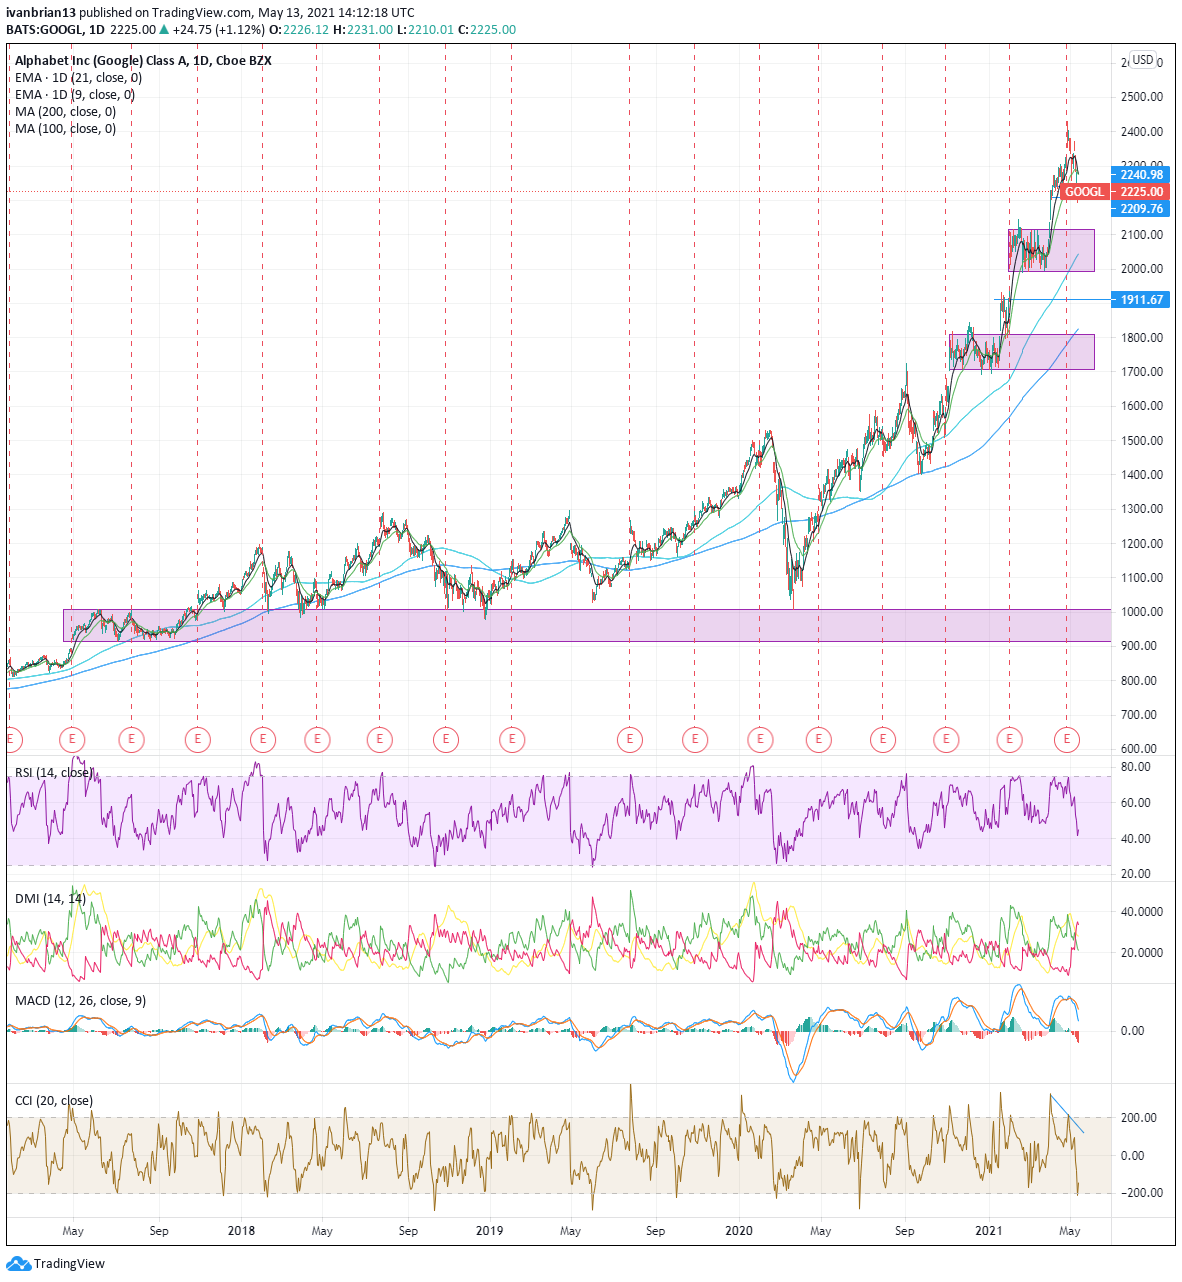
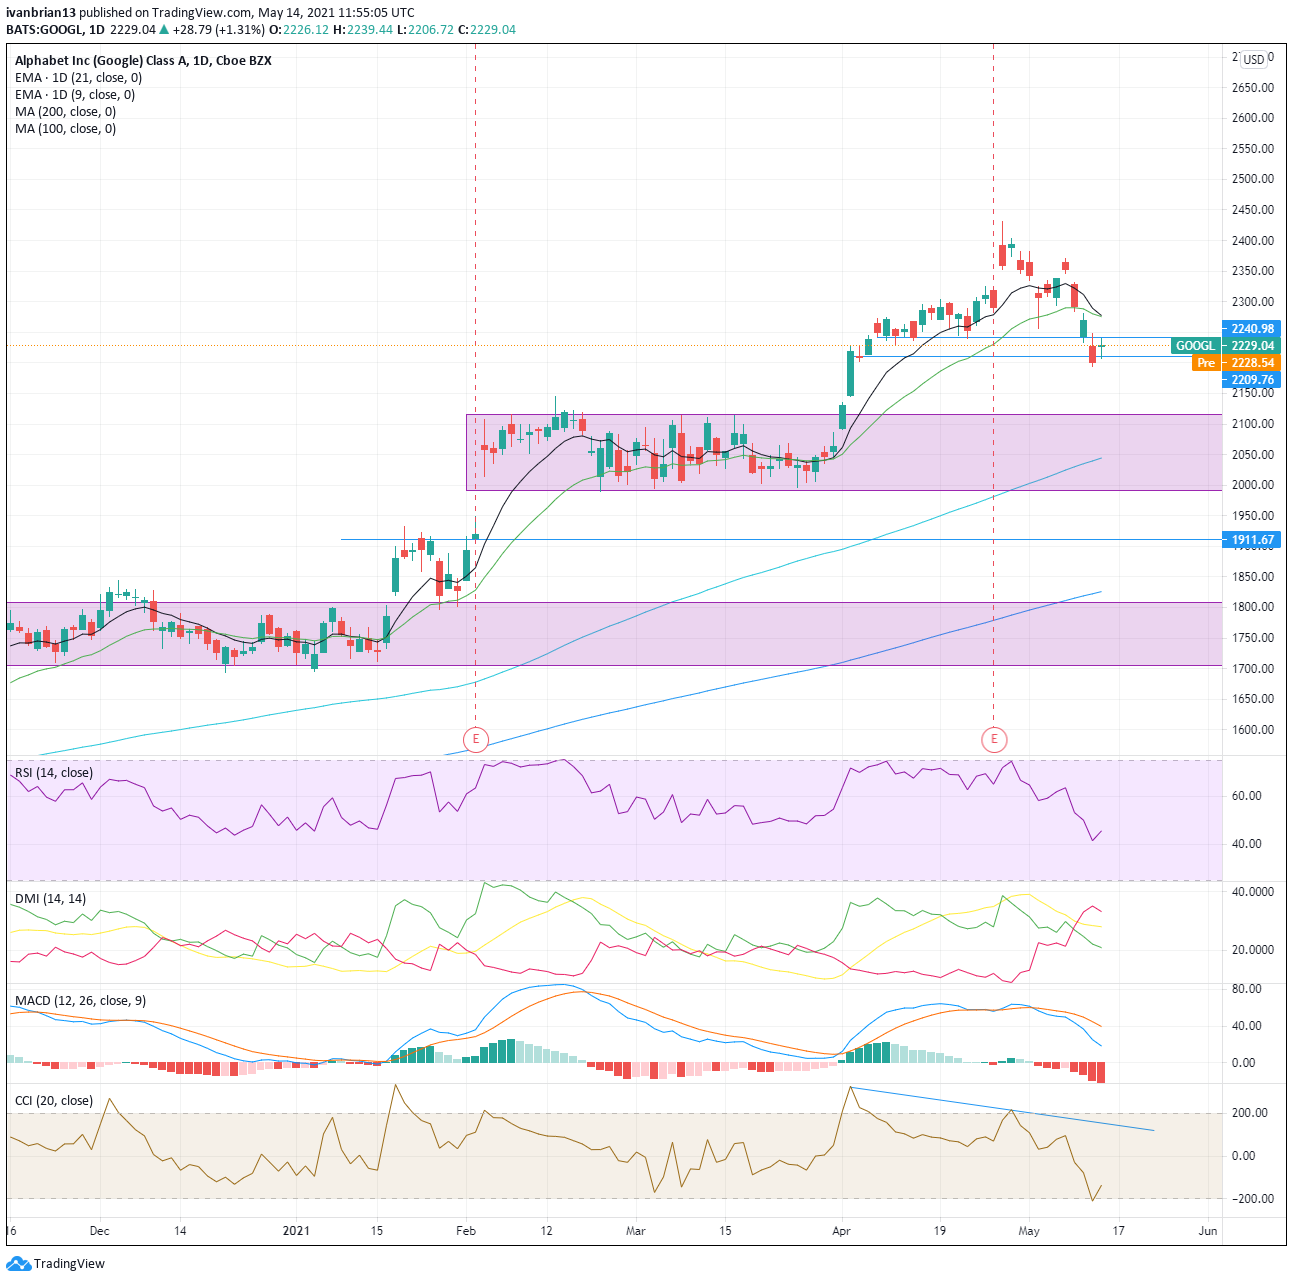
Google (GOOGL) stock forecast
There is a nice range play between the two key levels we identified on Thursday at $2,240 and $2,209. That pretty much captured the entire range for Thursday. Google closed at a completely neutral position right in the middle, further confusing us. Breaking $2,209 should see a trade quickly to the next range at $2,100-2,000. Below that is a strong buy zone, range at $1,800-1,700. Nine and 21-day moving averages are still trending lower and so are RSI and CCI, which are helping to confirm. MACD and DMI both remain crossed into bearish territory. The 200-day MA sits at $1,826, adding to this support region.
To turn bullish, GOOGL needs to get above $2,240 and then the short-term moving averages at $2,275. That should see a test of highs at $2,431.
| Support | 2209 | 2100 | 2000 | 1911 weak | 1800 | 1700 |
| Resistance | 2209 | 2240 key | 2280-90 | 2431 |
Tesla (TSLA) stock forecast
Tesla still remains under heavy selling pressure, understandable given its exceptionally strong price ratios, exponential price growth and now it becoming an S&P 500 component. This has reduced the options driven appreciation and introduced TSLA to a whole new world of statistical arbritage desks.
Tesla is still on course to go sub-$500 with a pit stop at $539 on the way. It had a brief notion to go positive on Thursday, but this was swiftly turned around and now we have a big red candle, never a great sign. Tesla also closed below the 200-day support we identified on Thursday. This now stands at $582.56 and remains a big level. This and the March 30 low at $591 are now resistance. Some Friday profit taking may see a bounce, and nothing goes up or down in a straight line, but Tesla is stuck firmly in a bearish trend. To turn around it needs to break $632, but only on a break of $667 does the bearishness firmly end.
$539 remains the first target and then a test of the sub-$500 consolidation 1 area identified on the chart. This is a pretty decent buy zone. A long period of price consolidations in the middle of a strong upward move.
MACD and DMI crossed into bearish territory. RSI and CCI have trended lower with the price, but both are now close to oversold levels.
| Support | 539 | 500 | 465 | 430 | ||
| Resistance | 582 | 591 | 667 bullish | 715 | 781 | 900 |
At the time of writing, the author has no position in any stock mentioned in this article and no business relationship with any company mentioned. The author has not received compensation for writing this article, other than from FXStreet.
This article is for information purposes only. The author and FXStreet are not registered investment advisors and nothing in this article is intended to be investment advice. It is important to perform your own research before making any investment and take independent advice from a registered investment advisor.
FXStreet and the author do not provide personalized recommendations. The author makes no representations as to accuracy, completeness, or the suitability of this information. FXStreet and the author will not be liable for any errors, omissions or any losses, injuries or damages arising from this information and its display or use. The author will not be held responsible for information that is found at the end of links posted on this page.
Errors and omissions excepted.
Information on these pages contains forward-looking statements that involve risks and uncertainties. Markets and instruments profiled on this page are for informational purposes only and should not in any way come across as a recommendation to buy or sell in these assets. You should do your own thorough research before making any investment decisions. FXStreet does not in any way guarantee that this information is free from mistakes, errors, or material misstatements. It also does not guarantee that this information is of a timely nature. Investing in Open Markets involves a great deal of risk, including the loss of all or a portion of your investment, as well as emotional distress. All risks, losses and costs associated with investing, including total loss of principal, are your responsibility. The views and opinions expressed in this article are those of the authors and do not necessarily reflect the official policy or position of FXStreet nor its advertisers. The author will not be held responsible for information that is found at the end of links posted on this page.
If not otherwise explicitly mentioned in the body of the article, at the time of writing, the author has no position in any stock mentioned in this article and no business relationship with any company mentioned. The author has not received compensation for writing this article, other than from FXStreet.
FXStreet and the author do not provide personalized recommendations. The author makes no representations as to the accuracy, completeness, or suitability of this information. FXStreet and the author will not be liable for any errors, omissions or any losses, injuries or damages arising from this information and its display or use. Errors and omissions excepted.
The author and FXStreet are not registered investment advisors and nothing in this article is intended to be investment advice.
Recommended content
Editors’ Picks
EUR/USD clings to daily gains above 1.0650

EUR/USD gained traction and turned positive on the day above 1.0650. The improvement seen in risk mood following the earlier flight to safety weighs on the US Dollar ahead of the weekend and helps the pair push higher.
GBP/USD recovers toward 1.2450 after UK Retail Sales data

GBP/USD reversed its direction and advanced to the 1.2450 area after touching a fresh multi-month low below 1.2400 in the Asian session. The positive shift seen in risk mood on easing fears over a deepening Iran-Israel conflict supports the pair.
Gold holds steady at around $2,380 following earlier spike

Gold stabilized near $2,380 after spiking above $2,400 with the immediate reaction to reports of Israel striking Iran. Meanwhile, the pullback seen in the US Treasury bond yields helps XAU/USD hold its ground.
Bitcoin Weekly Forecast: BTC post-halving rally could be partially priced in Premium

Bitcoin price shows no signs of directional bias while it holds above $60,000. The fourth BTC halving is partially priced in, according to Deutsche Bank’s research.
Week ahead – US GDP and BoJ decision on top of next week’s agenda

US GDP, core PCE and PMIs the next tests for the Dollar. Investors await BoJ for guidance about next rate hike. EU and UK PMIs, as well as Australian CPIs also on tap.