- An illiquid asset and leveraged traders trigger a black day for cryptocurrencies.
- The search for stellar returns often leads to a total loss of capital.
- Risk management is vital in managing this type of suicidal investment.
The collapse of MATIC today in Asian session should help us not to lose sight of the reason why we entered the crypto market: preserving and making money.
According to the latest information, the highly leveraged bullish positions triggered the carnage.
The story of these fulminant falls is always the same and its ingredients are quite simple:
- Anxious traders with a tendency to take too much leverage.
- Market narrowness refers to the inability of the order book to absorb a high amount of orders. In these situations, the price slips in the direction of the avalanche, then activates protection stops that increase the chain effect. And so on, until the order book is balanced again.
- Leverage in trading can be a great ally or the worst enemy. In the subject matter of this article, a leveraged position against an avalanche movement leads to the closing of the trading position. The action is so fast, and the losses so heavy, that the "margin call" sequence followed by the "closing of all positions" is practically instantaneous.
As much as it now seems like something like that only happens in the cryptocurrencies market, readers surely know similar situations in any other quoted market.
What can we do to protect ourselves?
- We should never take heavily leveraged positions in illiquid assets. This type of asset is easy to move. Those responsible for manipulation only need to give the first push, leverage and lack of funds do the rest of the work.
- The total capital we dedicate to this type of adventure should not exceed 5% of our money.
- If we take leveraged positions, we should not wait for consolidations. Any profit made must be executed immediately, without giving time to the accumulation of positions on the opposite side.
ETH/BTC Daily Chart
The ETH/BTC pair is currently trading at the 0.02004 price level and is timidly looking green. The simple average of 100 periods shows a bullish profile that augurs a cross of the long-term bearish trend line at the 0.021 level.
The price of the ETH/BTC pair will tend to that range first and should continue to rise towards the 200-period simple average passage zone.
Above the current price, the first resistance level is at 0.0205, then the second at 0.02225 and the third one at 0.023.
Below the current price, the first support level is at 0.02000, then the second at 0.019 and the third one at 0.018.
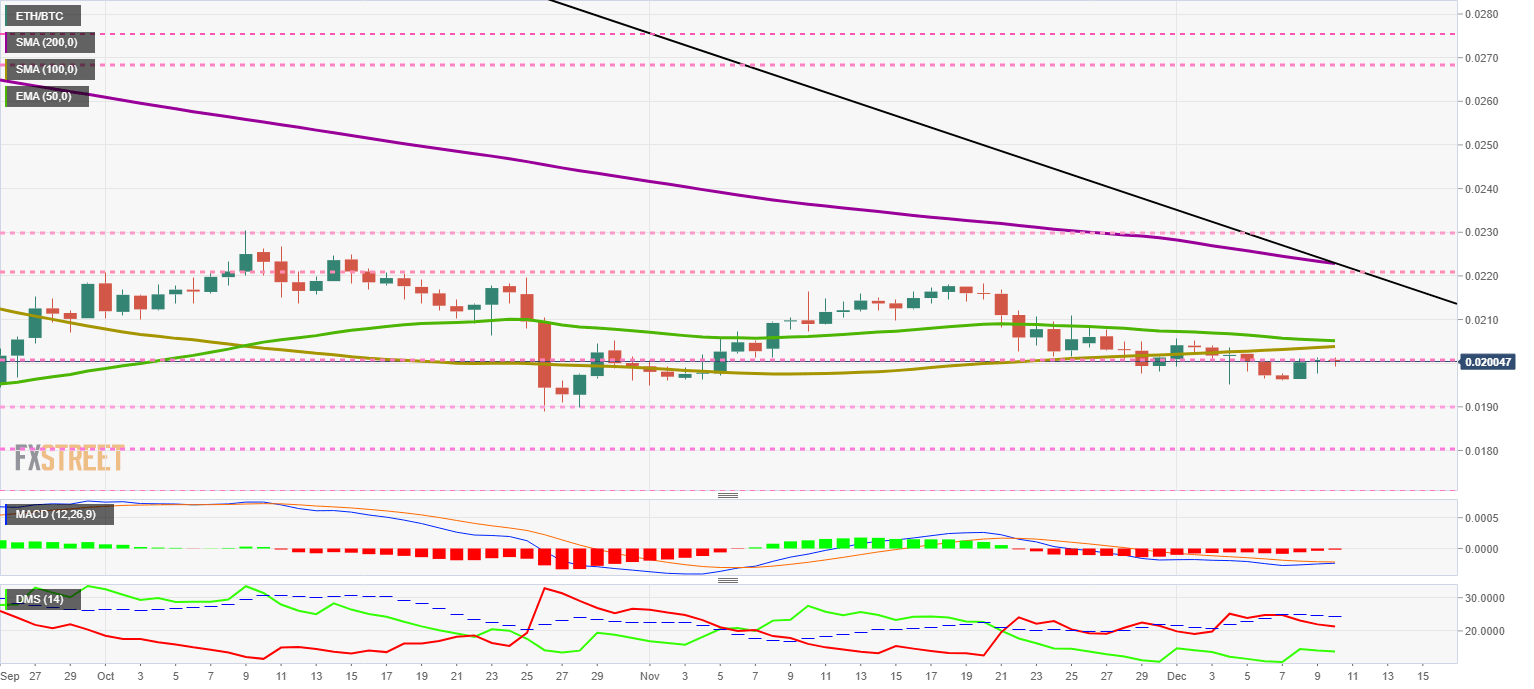
The MACD on the daily chart shows a bullish cross in development at the moment. The cross will culminate in the next few hours and should give way to a more positive tone in favor of the Ethereum.
The DMI on the daily chart shows bulls increasing trend strength against bears, which gradually lose power.
BTC/USD Daily Chart
The BTC/USD pair is currently trading at the $7,333 price level and points to a day of moderate price declines. Bitcoin's inability to beat the $7,500 daily close is a sign of weakness.
A stronger bearish move with a target at the $6,850 level cannot be ruled out.
Above the current price, the first resistance level is at $7,450, then the second at $7,500 and the third one at $7,600.
Below the current price, the first support level is at $7,100, then the second at $6,850 and the third one at $6,750.
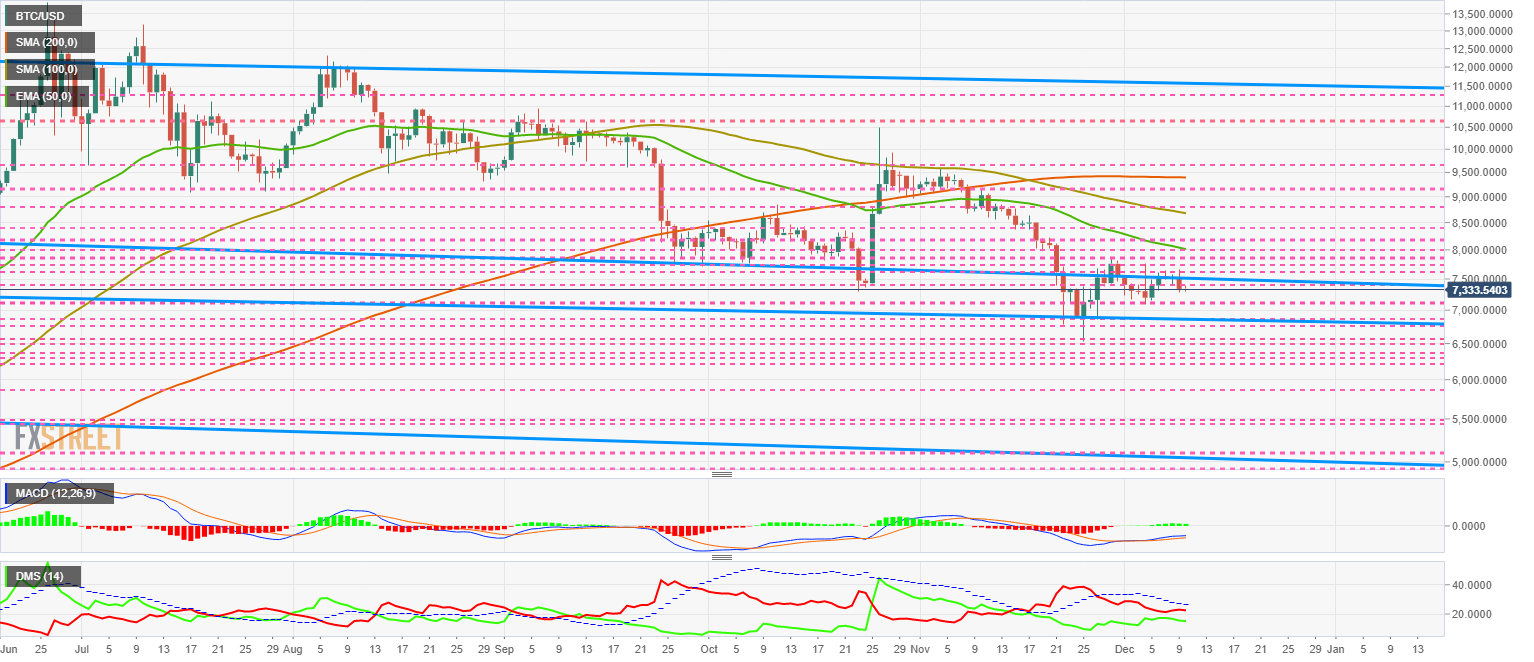
The MACD on the daily chart retains the bullish cross despite losing openness between the lines and the bullish incline. The closeness between the lines can cause a rejection movement to the price hike.
The DMI on the daily chart clearly shows “more-bullish” bulls in the same intensity with which bears follow it down.
ETH/USD Daily Chart
The ETH/USD pair is currently trading at the $147.3 price level, showing the difficulty of overcoming the resistance level at the $150 price level.
The release of the Istanbul upgrade has not meant any change in the Ethereum price.
Above the current price, the first resistance level is at $150, then the second at $155 and the third one at $160.
Below the current price, the first support level is at $145, then the second at $140 and the third one at $130.
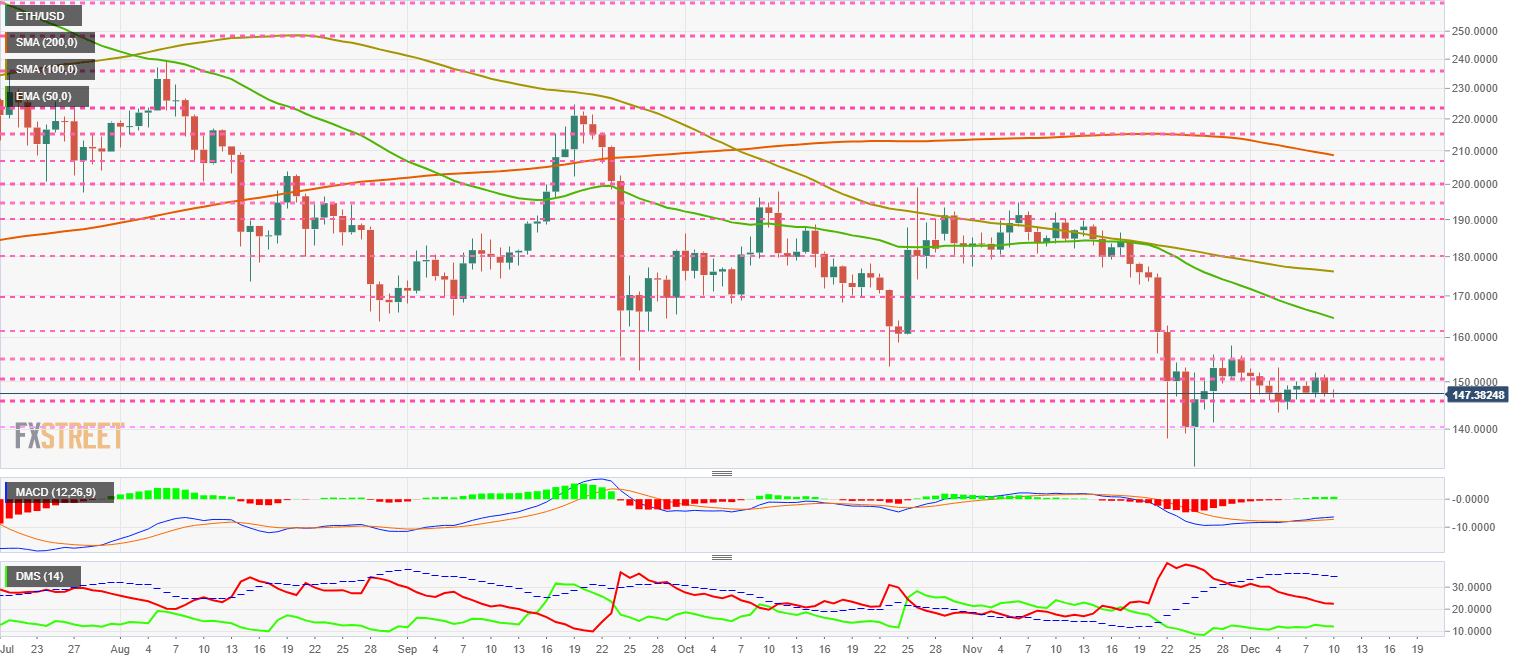
The MACD on the daily chart shows a slightly weakened bullish profile due to the impossibility of breaching the $150 price level.
The DMI on the daily chart shows the bulls gaining strength little by little. The bears, on the other hand, are continually losing trend-strength.
XRP/USD Daily Chart
XRP/USD is trading at the $0.223 price level, remaining within the same range as in the past few days.
Above the current price, the first resistance level is at $0.23, then the second at $0.245 and the third one at $0.248.
Below the current price, the first support level is $0.22, then the second level is $0.21, and the third level is $0.20.
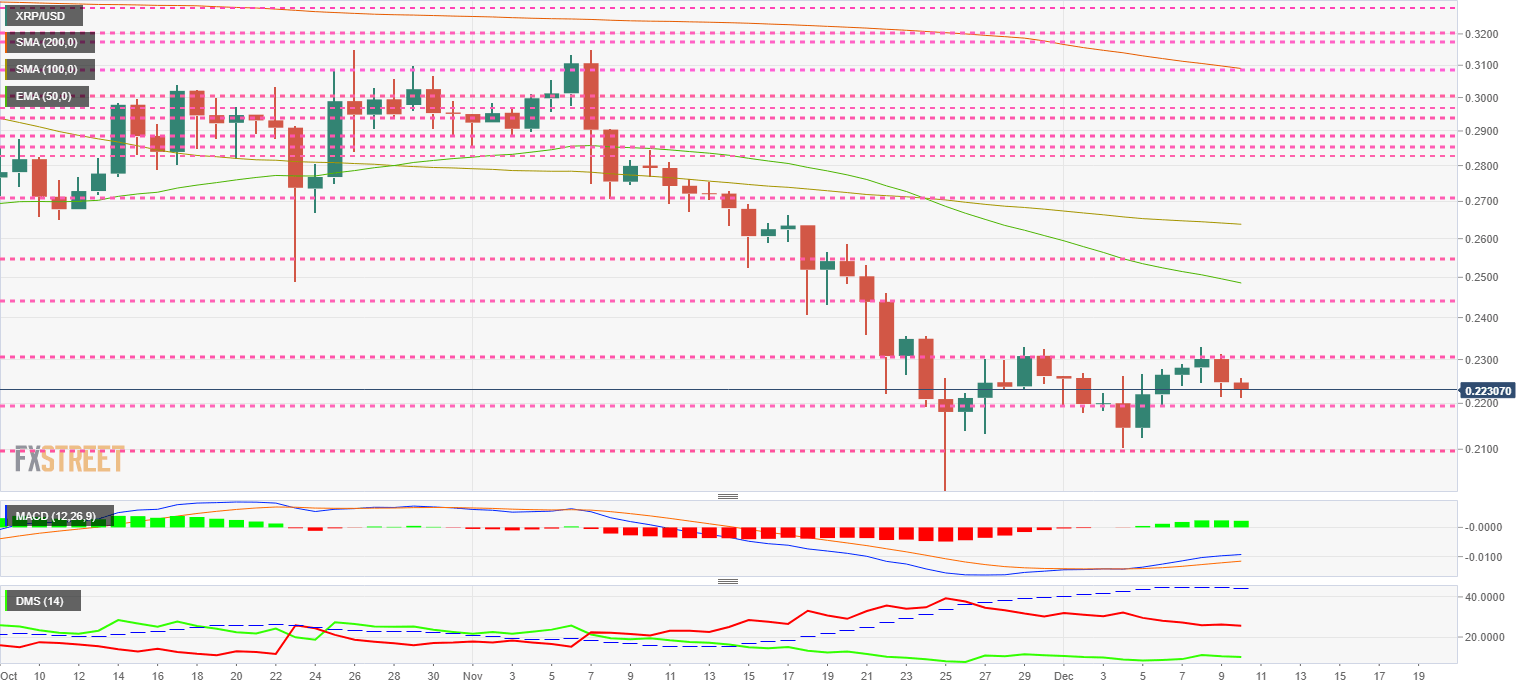
The MACD on the daily chart shows a clear bullish profile despite the sideways price in the last few days.
The DMI on the daily chart shows a small improvement in the activity level of the bulls, which nevertheless remain at deficient levels. The bears are gradually decreasing in their trend-strength level. A change of positions still seems distant.
Get 24/7 Crypto updates in our social media channels: Give us a follow at @FXSCrypto and our FXStreet Crypto Trading Telegram channel
Information on these pages contains forward-looking statements that involve risks and uncertainties. Markets and instruments profiled on this page are for informational purposes only and should not in any way come across as a recommendation to buy or sell in these assets. You should do your own thorough research before making any investment decisions. FXStreet does not in any way guarantee that this information is free from mistakes, errors, or material misstatements. It also does not guarantee that this information is of a timely nature. Investing in Open Markets involves a great deal of risk, including the loss of all or a portion of your investment, as well as emotional distress. All risks, losses and costs associated with investing, including total loss of principal, are your responsibility. The views and opinions expressed in this article are those of the authors and do not necessarily reflect the official policy or position of FXStreet nor its advertisers. The author will not be held responsible for information that is found at the end of links posted on this page.
If not otherwise explicitly mentioned in the body of the article, at the time of writing, the author has no position in any stock mentioned in this article and no business relationship with any company mentioned. The author has not received compensation for writing this article, other than from FXStreet.
FXStreet and the author do not provide personalized recommendations. The author makes no representations as to the accuracy, completeness, or suitability of this information. FXStreet and the author will not be liable for any errors, omissions or any losses, injuries or damages arising from this information and its display or use. Errors and omissions excepted.
The author and FXStreet are not registered investment advisors and nothing in this article is intended to be investment advice.
Recommended Content
Editors’ Picks
PancakeSwap loses nearly 3% value intraday as the DEX crosses $1 billion in trade volume

Decentralized exchange (DEX) PancakeSwap (CAKE) announced in an official tweet that it has crossed $1 billion in trade volume on the Layer 2 chain, Base. CAKE on-chain metrics support the thesis of a recovery in the DEX token’s price.
Shiba Inu hits new milestone, over $9 billion worth of SHIB tokens burnt

Shiba Inu (SHIB), the second-largest meme coin in the crypto ecosystem, recently hit a milestone in the volume of tokens burned. Shiba Inu has burnt over 410.72 trillion SHIB tokens since the inception of the burn mechanism in the project, worth over $9 billion.
Dogwifhat crashes 60%, but here's why you should not buy WIF yet Premium

Dogwifhat (WIF) price shows a slowdown in the bearish momentum as it sets up a potential range. This development could lead to a good buying opportunity from a long-term perspective.
XRP struggles to overcome $0.50 resistance, SEC vs. Ripple could enter final pretrial conference

XRP is struggling with resistance at $0.50 as Ripple and the US Securities and Exchange Commission (SEC) are gearing up for the final pretrial conference on Tuesday at a New York court.
Bitcoin: BTC’s rangebound movement leaves traders confused

Bitcoin (BTC) price has been hovering around the $70,000 psychological level for a few weeks, resulting in a rangebound movement. This development could lead to a massive liquidation on either side before a directional move is established.