EUR/USD Current price: 1.1251
View Live Chart for the EUR/USD

The American dollar has fallen against all of its major counterparts this Wednesday, although the EUR underperformed across the board, on speculation the ECB's Monetary Policy meeting accounts will offer hints of further easing coming from the Central Bank, before the year end. Risk appetite led the financial boards, with stocks generally higher worldwide. This Thursday, however, Chinese markets will re-open after being closed since the end of September, and may disrupt the recent positive mood. From the macroeconomic front, German data disappointed once again, as the country's Industrial Production in August fell 1.2%, against expectations of a 0.2% advance, while there were no relevant news in the US.
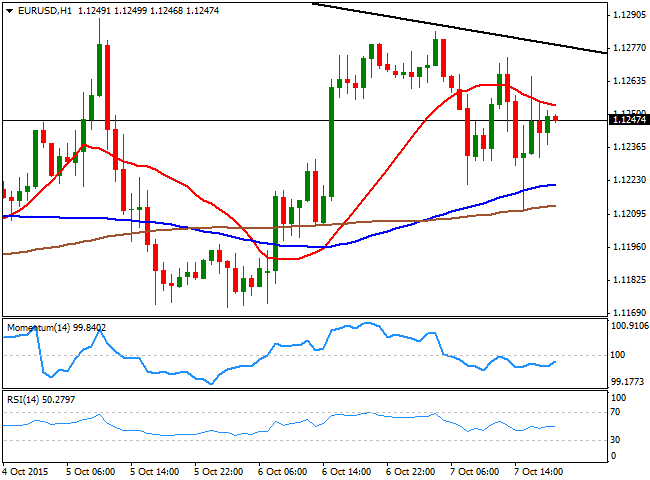
The EUR/USD pair continued trading within its daily triangle, advancing during Asian hours up to 1.1283, where it met speculative selling interest, and retreated down to 1.1210 during the American morning. Nevertheless, the pair is ending the day with some gains, although with no clear directional strength according to technical readings, given that the 1 hour chart shows that the price is a few pips below a bearish 20 SMA, whilst the technical indicators head nowhere in negative territory. In the 4 hours chart, the price is stuck within its moving averages, whilst the technical indicators stand flat around their mid-lines. Additional gains beyond 1.1285 should lead to a test of 1.1335, a strong static resistance level, but it will take a clear break above this last to confirm a steadier upward continuation.
Support levels: 1.1200 1.1160 1.1120
Resistance levels: 1.1285 1.1335 1.1370
EUR/JPY Current price: 134.84
View Live Chart for the EUR/JPY
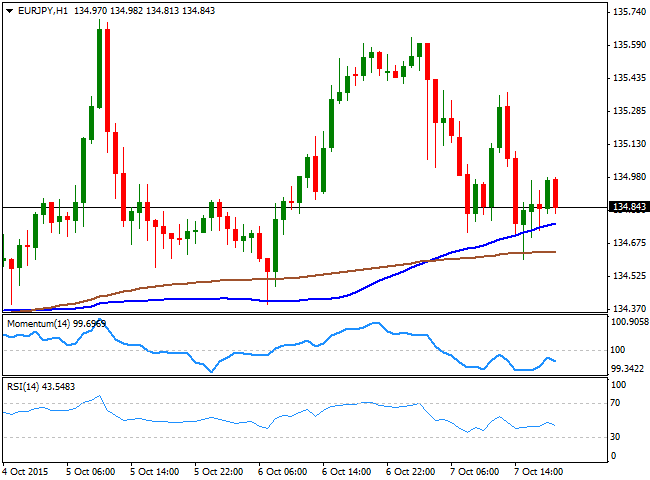
The EUR/JPY pair retreated from its Tuesday's high to end the day below the 135.00 figure, as the Japanese yen strengthened during the Asian session following the BOJ's decision to maintain its economic policy unchanged. The pair fell down to 134.60 before bouncing, and the 1 hour chart shows that it found there support around its 200 SMA, although the technical indicators have turned lower below their mid-lines, having been unable to overcome their mid-lines, which means the risk remains towards the downside. In the 4 hours chart, the price is below its 100 and 200 SMAs, both presenting limited bearish slopes, while the Momentum indicator has crossed its mid-line towards the downside, and the RSI indicator also heads lower and enters negative territory, pointing for additional declines, to be confirmed on a break below the mentioned daily low.
Support levels: 134.60 134.20 133.70
Resistance levels: 135.30 135.70 136.20
GBP/USD Current price: 1.5316
View Live Chart for the GPB/USD
The British Pound broke higher against the greenback, extending its intraday rally up to 1.5338 a fresh 2 week high, before pulling back some before Wall Street's closing bell. The GBP got a boost from local data, as in the UK, total production output was estimated to have risen by 1.9% in August compared to the same month in 2014, whilst monthly basis, it rose 0.5% against 0.3% expected. Year-on-year, manufacturing production fell 0.8%, but rose 1.0% in the month. The pair has settled around 1.5315 afterwards, which represents the 38.2% retracement of the latest daily decline a major resistance level. Technically, the 1 hour chart shows that the 20 SMA has advanced alongside with the price, and stands now around 1.5280, whilst the Momentum indicator hovers around overbought levels, and the RSI turned slightly lower around 65, suggesting a short term downward corrective move. In the 4 hours chart, the Momentum indicator has finally picked up and maintains its bullish slope, whilst the RSI indicator consolidates in overbought territory. In this last time frame, the 200 EMA converges with the daily high, which means a break above it is required to confirm a continued advance, eyeing then an advance beyond the 1.5400 level.
Support levels: 1.5260 1.5220 1.5170
Resistance levels: 1.5340 1.5390 1.5430
USD/JPY Current price: 119.97
View Live Chart for the USD/JPY
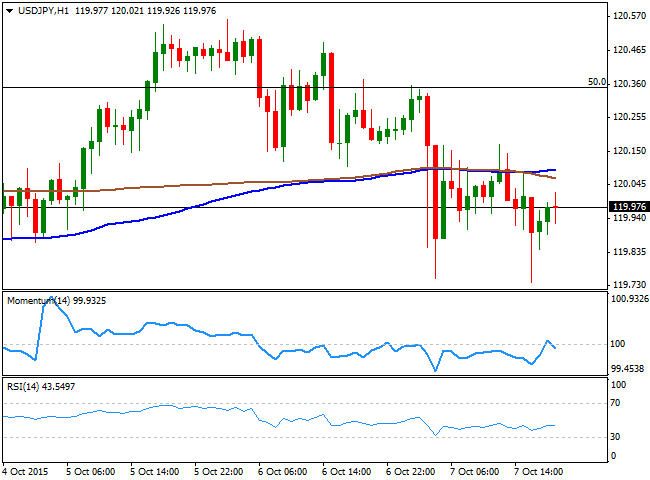
The USD/JPY pair fell down to 119.75 at the beginning of the day, after the Bank of Japan opted to continue increasing its monetary base at an annual pace of ¥80 trillion. Although the outcome of the meeting was largely expected, the Japanese Nikkei fell with the news, triggering intraday gains in the JPY. The pair later recovered above the 120.00 level amid stocks' rallying, but remained subdued, unable to attract buying interest. Heading into the Asian session, the 1 hour chart shows that the price is now below its 100 and 200 SMAs that remain flat around 120.10, while the technical indicators have turned south around their mid-lines, pointing for some additional declines. In the 4 hours chart, the Momentum indicator heads strongly lower below its 100 level, whilst the RSI indicator also heads south around 45, all of which supports the shorter term view.
Support levels: 119.70 119.35 118.90
Resistance levels: 120.35 120.70 121.00
AUD/USD Current price: 0.7204
View Live Chart for the AUD/USD
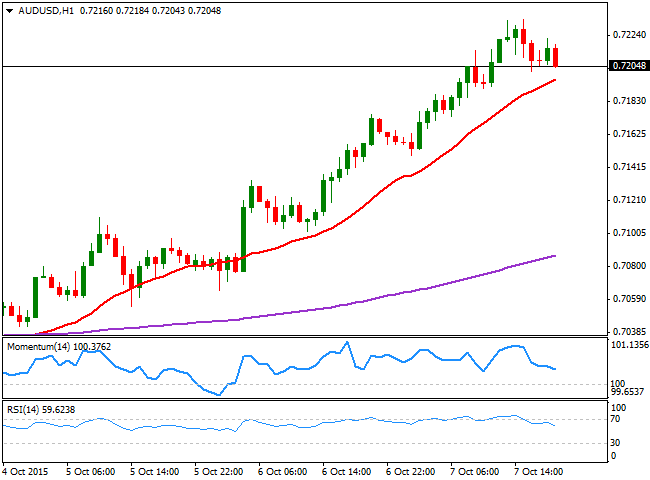
The AUD/USD pair advanced to a fresh 3-week high of 0.7234, as commodity currencies strengthened on the back of surging oil and metals prices. The Aussie held to its intraday gains, having found some short term buying interest around the 0.7200 level on intraday pullbacks. Both, gold and oil eased during the American afternoon, which may lead to a downward corrective movement in the pair, particularly if Chinese stocks ignore the latest advance in stocks and trade lower. Technically, the 1 hour chart shows that the price holds above a bullish 20 SMA, currently offering an immediate support around 0.7190, while the technical indicators have retreated from overbought territory, but hold still well above their mid-lines. In the 4 hours chart, the 20 SMA advanced further below the current price, converging now with the 200 EMA in the 0.7110 region, whilst the technical indicators have turned sharply lower from extreme overbought levels, supporting also a bearish corrective move, should the price extend below the 0.7190 mentioned support.
Support levels: 0.7190 0.7145 0.7110
Resistance levels: 0.7235 0.7280 0.7330
Information on these pages contains forward-looking statements that involve risks and uncertainties. Markets and instruments profiled on this page are for informational purposes only and should not in any way come across as a recommendation to buy or sell in these assets. You should do your own thorough research before making any investment decisions. FXStreet does not in any way guarantee that this information is free from mistakes, errors, or material misstatements. It also does not guarantee that this information is of a timely nature. Investing in Open Markets involves a great deal of risk, including the loss of all or a portion of your investment, as well as emotional distress. All risks, losses and costs associated with investing, including total loss of principal, are your responsibility. The views and opinions expressed in this article are those of the authors and do not necessarily reflect the official policy or position of FXStreet nor its advertisers. The author will not be held responsible for information that is found at the end of links posted on this page.
If not otherwise explicitly mentioned in the body of the article, at the time of writing, the author has no position in any stock mentioned in this article and no business relationship with any company mentioned. The author has not received compensation for writing this article, other than from FXStreet.
FXStreet and the author do not provide personalized recommendations. The author makes no representations as to the accuracy, completeness, or suitability of this information. FXStreet and the author will not be liable for any errors, omissions or any losses, injuries or damages arising from this information and its display or use. Errors and omissions excepted.
The author and FXStreet are not registered investment advisors and nothing in this article is intended to be investment advice.
Recommended Content
Editors’ Picks

EUR/USD loses the grip and challenges 1.0400
A robust, tariff-driven upswing in the US Dollar is now driving EUR/USD to deepen its daily losses, closing in on the key support at 1.0400 the figure ahead of scheduled speeches from Federal Reserve officials and President Trump.

GBP/USD keeps its offered bias around 1.2630 on USD buying
Following the lead of other risk-sensitive currencies, GBP/USD is giving way to renewed buying pressure on the Greenback, keeping the trade around 1.2630 ahead of remarks from Fed policymakers and President Trump.

Gold flirts with two-week lows around $2,880
Gold prices resume their downtrend and revisit two-week lows in the sub-$2,880 zone per ounce troy following the improved tone in the US Dollar, higher yields and further tariff narrative.

Bitcoin recovers above $85,000 while institutional investors offload their holdings
Bitcoin (BTC) recovers slightly and trades around $86,000 at the time of writing on Thursday after falling nearly 15% at one point this week. US President Donald Trump’s ongoing tariff news and falling institutional demand fueled the BTC’s correction.

February inflation: Sharp drop expected in France, stability in the rest of the Eurozone
Inflation has probably eased in February, particularly in France due to the marked cut in the regulated electricity price. However, this overall movement masks divergent trends. Although disinflation is becoming more widespread, prices continue to rise rapidly in services, in France as well as elsewhere in the Eurozone.

The Best brokers to trade EUR/USD
SPONSORED Discover the top brokers for trading EUR/USD in 2025. Our list features brokers with competitive spreads, fast execution, and powerful platforms. Whether you're a beginner or an expert, find the right partner to navigate the dynamic Forex market.