EUR/USD Current price: 1.1355
View Live Chart for the EUR/USD
The EUR/USD pair has managed to close the week with gains, thanks to the dovish FED's stance in regards of its upcoming economic policy. The US Central Bank´s decision was partially overshadowed the Greek drama, as a new deal for fresh cash has not yet been reached, and that kept EUR´s gains limited. A special summit between European authorities has been scheduled for this Monday, pretty much a last attempt to help the troubled country remain in the EU. Over the weekend, Greece announced it has delivered a new proposal to its counterparts, but there's no other news in the matter ahead of a new weekly opening.
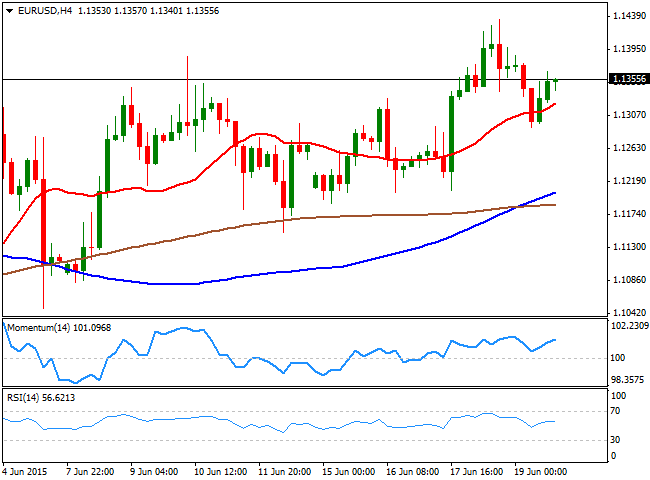
The market has been paying little attention to Greece's headlines lately, as investors are pretty much waiting for a final resolution of the matter, either for good or for bad, before setting their positions in EUR crosses. As for the technical picture, the 4 hours chart shows that the bullish tone prevails, with the pair developing above its moving averages and the technical indicators heading north above their mid-lines. With the price holding mid-range in the 1.1300 region, the critical resistance for this upcoming days stands around 1.1466, last May monthly high, level that can be reached, should Greece made a deal with its creditors, with a break above it exposing February monthly high of 1.1533. The key support, in case of another failure, stands at 1.1250, a strong static support level, with a break below it exposing the 1.1120 price zone.
Support levels: 1.1325 1.1280 1.1245
Resistance levels: 1.1370 1.1410 1.1460
EUR/JPY Current price: 139.21
View Live Chart for the EUR/JPY
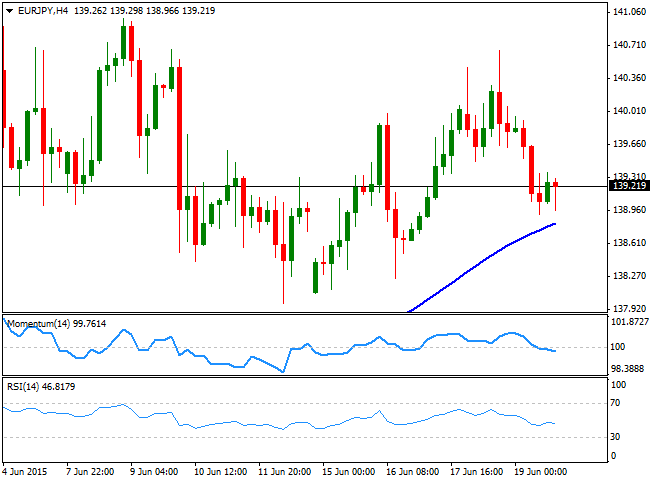
The EUR/JPY cross was unable to recoup the 140.00 level last week, despite recovering some of the ground lost following BOJ's Governor Kuroda comments of JPY exchange rate earlier this month. The Japanese currency also strengthened on dollar's weakness, albeit EUR's strength kept the cross balanced. The lower high weekly basis, has increased the downward risk, and the daily chart shows that the Momentum indicator is crossing below the 100 level with a sharp bearish slope, suggesting additional declines ahead, towards 137.15, the 200 DMA. Shorter term, the 4 hours chart shows that the price has approached a bullish 100 SMA, currently providing an immediate intraday support around 138.80, whilst the technical indicators head lower below their mid-lines, albeit lacking strength at the time being. If the price manages to extend below it, the decline can extend down to 137.90, last week low and a line in the sand for the upcoming days, as a break below this last should confirm a stronger decline towards the 136.00 region.
Support levels: 138.80 138.35 137.90
Resistance levels: 139.60 140.05 140.50
GBP/USD Current price: 1.5838
View Live Chart for the GBP/USD
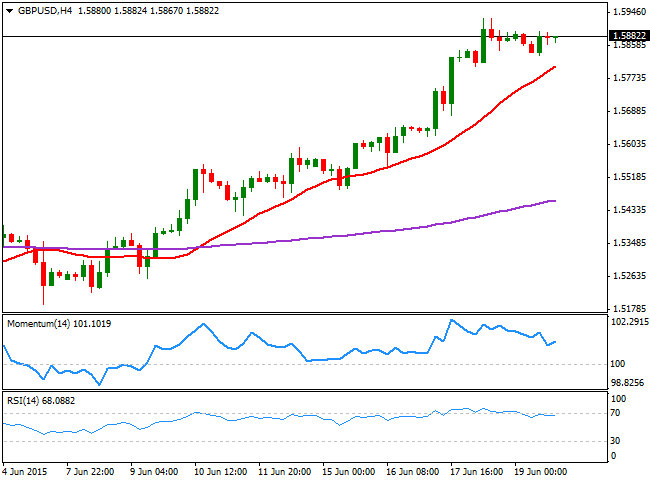
The British Pound surged to a fresh year high of 1.5929 against the greenback last week, holding to its gains by the week close and trading a few pips below it. The GBP/USD pair has closed in the green for 10 days in-a-row, boosted by positive local data, and the fact that the UK has distanced from Europe and the Greek issue. A weaker dollar has supported the bullish case of the Pound, albeit a downward corrective movement, after a steady 700 pips advance, can't be disregarded. The daily chart shows that the technical indicators are beginning to look exhausted in overbought territory, yet still far from signaling a downward corrective movement underway. Shorter term, the 4 hours chart shows that the price remains above a strongly bullish 20 SMA, currently around 1.5805, whilst the Momentum indicator has resumed its advance after correcting overbought readings, and the RSI indicator hovers flat around 68, all of which maintains the risk towards the upside. At this point, deeps down to 1.5770 are seen as buying opportunities rather than a confirmation of an interim top, as the pair needs to extend below the 1.5700 level to actually turn bearish.
Support levels: 1.5850 1.5805 1.5770
Resistance levels: 1.5890 1.5930 1.5965
USD/JPY Current price: 122.71
View Live Chart for the USD/JPY
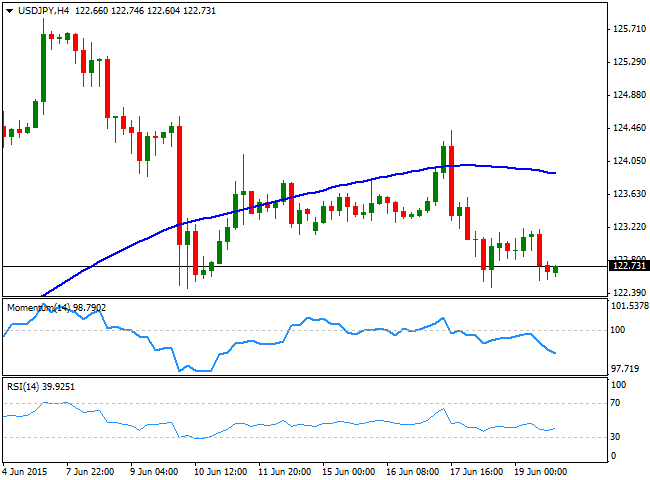
The USD/JPY pair holds near its 3-week low of 122.45, as a dovish FED and weaker-than-expected US inflation readings have kept the USD subdued last week. The pair has lost its bullish strength after toping near 126.00 following US Nonfarm Payrolls release earlier this month, and the daily chart shows that the price holds far above its moving averages, with the 100 DMA currently around 120.80, although he technical indicators maintain their strong bearish slopes below their mid-lines, keeping the risk towards the downside. In the 4 hours chart, the price was capped by its 100 SMA, now around 124.00, whilst the Momentum indicator heads sharply lower in negative territory, and the RSI indicator consolidates in negative territory, all of which maintains the risk towards the downside. With the price having bottomed around the mentioned 122.45 level twice, a downward acceleration below it should signal a bearish continuation towards the mentioned 120.80 level, before buying interest re-surges.
Support levels: 122.40 122.00 121.60
Resistance levels: 122.90 123.30 123.70
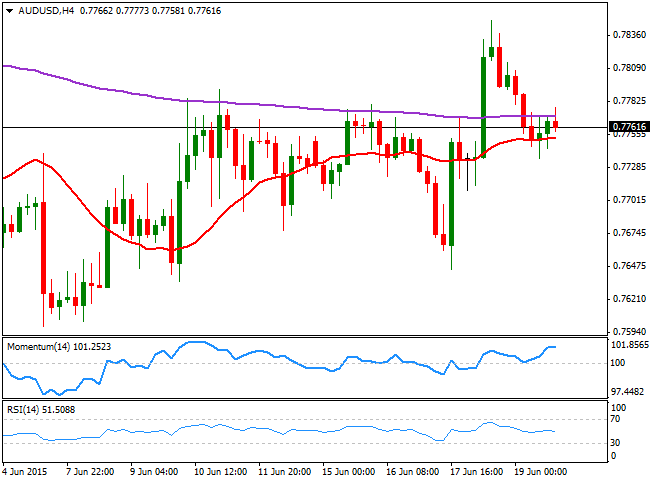
AUD/USD Current price: 0.7761
View Live Chart for the AUD/USD
The Australian dollar edged slightly higher against the greenback last week, with the pair however, unable to settle above the 0.7800 level. The Aussie was weighed last week by a sharp decline in metal's prices, with the iron ore falling towards its record lows last week, but managed to post a 3-week high of 0.7848. Nevertheless, the bearish bias prevails, as in the daily chart, the technical indicators have turned south and are about to cross their mid-lines, whilst the 20 SMA provides an immediate short term support around 0.7700, which means it will take a break below this level to confirm a downward continuation. In the 4 hours chart, the price is confined to a tight range, right below a horizontal 200 EMA, around 0.7775, and its 20 SMA, whilst the Momentum indicator has turned flat in positive territory, and the RSI gains bearish tone around 51.
Support levels: 0.7735 0.7690 0.7640
Resistance levels: 0.7775 0.7820 0.7850
Recommended Content
Editors’ Picks

EUR/USD resumes slide below 1.0500
EUR/USD gained modest upward traction ahead of Wall Street's opening but resumed its slide afterwards. The pair is under pressure in the American session and poised to close the week with losses near its weekly low at 1.0452.
GBP/USD nears 1.2600 as the US Dollar regains its poise
Disappointing macroeconomic data releases from the UK put pressure on the British Pound, yet financial markets are all about the US Dollar ahead of the weekly close. Demand for the Greenback increased in the American session, pushing GBP/USD towards 1.2600.

Gold pierces $2,660, upside remains capped
Gold (XAU/USD) puts pressure on daily lows and trades below $2,660 on Friday’s early American session. The US Dollar (USD) reclaims its leadership ahead of the weekly close, helped by rising US Treasury yields.
Broadcom is the newest trillion-dollar company Premium
Broadcom (AVGO) stock surged more than 21% on Friday morning after management estimated on Thursday’s earnings call that the market for customized AI accelerators might reach $90 billion in fiscal year 2027.

Can markets keep conquering record highs?
Equity markets are charging to new record highs, with the S&P 500 up 28% year-to-date and the NASDAQ Composite crossing the key 20,000 mark, up 34% this year. The rally is underpinned by a potent mix of drivers.

Best Forex Brokers with Low Spreads
VERIFIED Low spreads are crucial for reducing trading costs. Explore top Forex brokers offering competitive spreads and high leverage. Compare options for EUR/USD, GBP/USD, USD/JPY, and Gold.
