EUR/USD Current price: 1.1009
View Live Chart for the EUR/USD
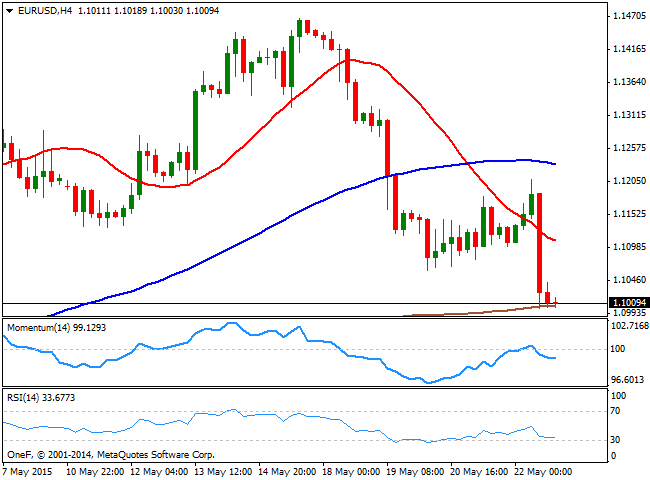
The EUR/USD pair collapsed on Friday, following the release of US CPI figures for April, showing that core inflation rose for the most in two years, approaching to FED's goal. Earlier in the week, the FOMC Minutes showed that Central Bank officers consider a June rate hike as "unlikely," but surging inflation fueled market hopes that the Federal Reserve will begin tightening its economic policy in the upcoming months. Adding to dollar's strength, news over the weekend may result in further declines, as the Greek interior minister stated on Sunday that the country cannot make debt repayments to the UMF next month unless it achieves a deal with its creditors, whilst PM Tsipras said that the country won't accept a deal with "humiliating terms." The negotiations between the troubled country and the rest of the EU has made no progress in this past four months of a Syriza government.
From a technical point of view, the EUR/USD pair closed the week a few pips above the 1.1000 figure, and is positioned to extend its decline, as the 4 hours char shows that the price develops well below a bearish 20 SMA, whilst the technical indicators turned sharply lower after a brief advance above their mid-lines, maintaining their bearish slopes, and with the RSI indicator nearing 30. Bigger time frames show that the extreme oversold conditions reached earlier this year have been erased, and that the technical indicators have turned back lower, suggesting the latest recovery has been corrective. The pair has a strong static support around 1.0960, and a break below it should trigger stops and fuel the slide this Monday, with sellers now probably surging around the 1.1050 region.
Support levels: 1.0960 1.0910 1.0870
Resistance levels: 1.1050 1.1100 1.1145
EUR/JPY Current price: 133.82
View Live Chart for the EUR/JPY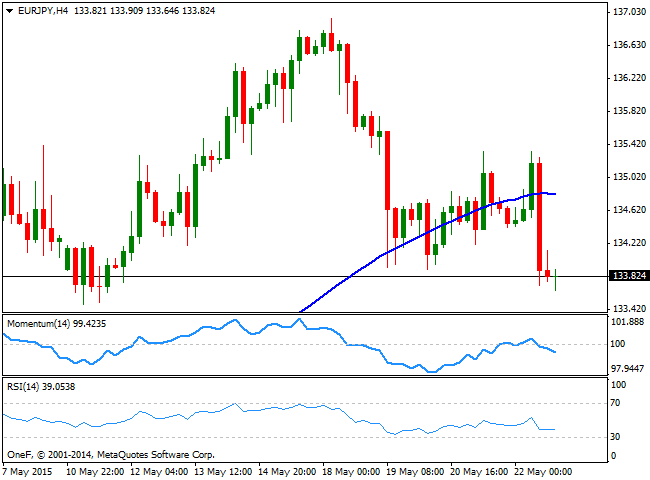
The EUR/JPY traded in the red during the past week, having been capped early Monday by the 200 DMA currently around 136.90. The Japanese yen held ground against a weaker EUR, as the Bank of Japan decided to keep its economic policy unchanged this month. Nevertheless, both currencies traded generally lower against the greenback, leaving the cross confined to a tight range. Technically, the 4 hours chart shows that the price finally broke below its 100 SMA on Friday after struggling around its for most of the week, whilst the Momentum indicator heads lower below the 100 level and the RSI indicator holds flat around 39. With the price barely holding around a 2-week low, the risk remains towards the downside, with a break below the 133.00 level required to confirm a midterm bearish continuation, with another strong support standing around 132.00, the 100 DMA.
Support levels: 133.45 133.00 132.55
Resistance levels: 134.30 134.70 135.20
GBP/USD Current price: 1.5480
View Live Chart for the GBP/USD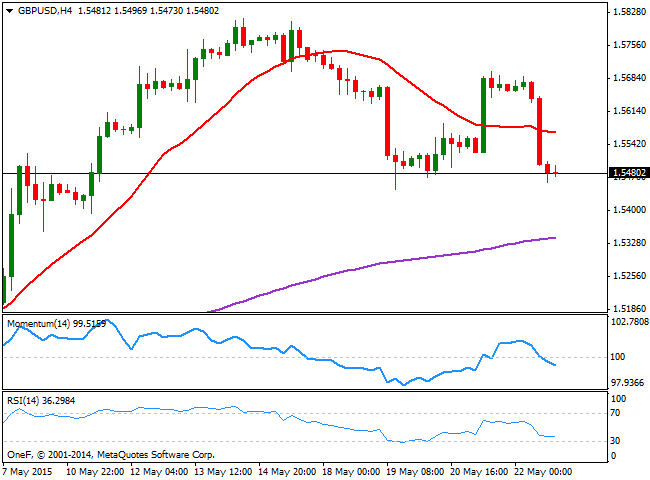
The GBP/USD pair failed to hold to the gains achieved on Thursday following the release of up beating Retail Sales in the UK, losing almost 200 pips on Friday, amid broad dollar's strength. The Pound however, declined at a slower pace than any other currency against the greenback on weekly basis, as the Bank of England is expected to follow the FED in the tightening path, but by 2016. The GBP/USD pair 4 hours chart shows that the price is now developing below its 20 SMA, now flat around 1.5580, whilst the 200 EMA provides a strong mid-term support for this week in the 1.5340 region. The Momentum indicator in the mentioned time frame maintains a strong bearish slope below its 100 level, whilst the RSI indicator is losing its downward strength around 36, far from suggesting a short term upcoming reversal in the ongoing direction. The weekly low stands at 1.5445, the immediate short term support, and a break below it should lead to a decline towards the mentioned 200 EMA around 1.5340 this Monday.
Support levels: 1.5445 1.5400 1.5340
Resistance levels: 1.5495 1.5535 1.5580
USD/JPY Current price: 121.55
View Live Chart for the USD/JPY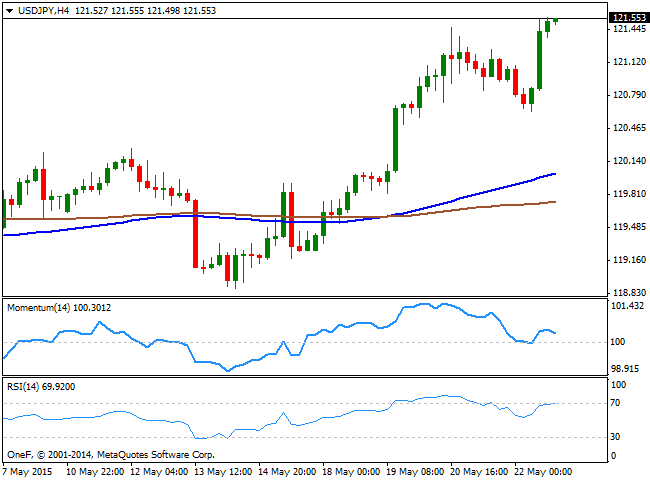
The USD/JPY pair surged sharply last week, approaching the year high set at 122.02 on March 2nd, after almost two months of steady consolidation around the 120.00 level. The advance was supported by rising US yields, as the 10y note ones ended the week around 2.22%. The pair closed the week at its highest level in two months, and the technical picture favors additional advances, as the price has finally moved away from its 100 DMA, currently around 119.60. The 4 hours chart shows that the price stands far above its 100 and 200 SMAs, both in the 119.60/90 region, with the shortest advancing above the largest, signaling bulls are in control. In the same time frame, the Momentum indicator turned lower above the 100 level, whilst the RSI indicator has turned flat around 70, suggesting the pair may see a short term downward correction, before a new leg north. Nevertheless, an upward acceleration through the 121.60 level should limit chances of such correction and see the pair advancing towards the mentioned year high.
Support levels: 121.15 120.85 120.45
Resistance levels: 121.60 122.10 122.50
AUD/USD Current price: 0.7831
View Live Chart for the AUD/USD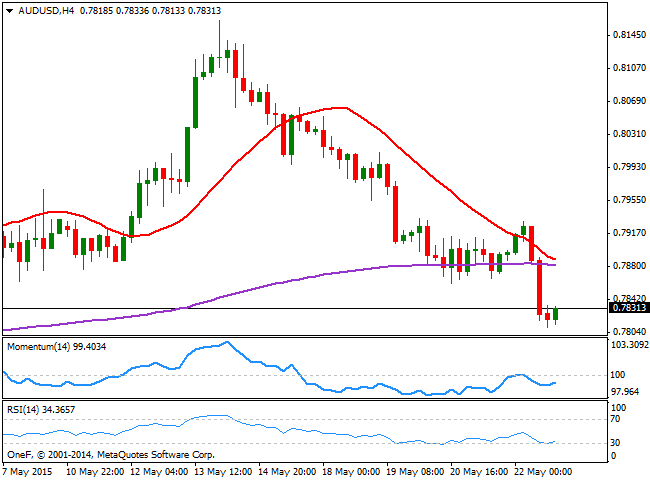
The Australian dollar fell down to 0.7810 against the greenback last Friday, the lowest level in over 2-weeks. The AUD/USD pair was weighted by the imbalance between both Central Banks, as in its latest policy meeting, the RBA opened doors for another rut cut this year. The technical picture shows that the price broke clearly below its 200 SMA for the first time since late April, and extended below it, whilst the 20 SMA presents a strong bearish slope and both moving average converge around 0.7890, providing a strong dynamic resistance. In the same time frame, however, the RSI is posting a tepid bounce from oversold levels, whilst the Momentum indicator also aims higher, but remains below the 100 level. Should the decline extend below the mentioned 0.7810 level, a bearish continuation is favored for the upcoming sessions, eyeing then a continued decline towards the 0.7700 price zone.
Support levels: 0.7810 0.7780 0.7750
Resistance levels: 0.7845 0.7890 0.7930
Recommended Content
Editors’ Picks

EUR/USD resumes slide below 1.0500
EUR/USD gained modest upward traction ahead of Wall Street's opening but resumed its slide afterwards. The pair is under pressure in the American session and poised to close the week with losses near its weekly low at 1.0452.
GBP/USD nears 1.2600 as the US Dollar regains its poise
Disappointing macroeconomic data releases from the UK put pressure on the British Pound, yet financial markets are all about the US Dollar ahead of the weekly close. Demand for the Greenback increased in the American session, pushing GBP/USD towards 1.2600.

Gold pierces $2,660, upside remains capped
Gold (XAU/USD) puts pressure on daily lows and trades below $2,660 on Friday’s early American session. The US Dollar (USD) reclaims its leadership ahead of the weekly close, helped by rising US Treasury yields.
Broadcom is the newest trillion-dollar company Premium
Broadcom (AVGO) stock surged more than 21% on Friday morning after management estimated on Thursday’s earnings call that the market for customized AI accelerators might reach $90 billion in fiscal year 2027.

Can markets keep conquering record highs?
Equity markets are charging to new record highs, with the S&P 500 up 28% year-to-date and the NASDAQ Composite crossing the key 20,000 mark, up 34% this year. The rally is underpinned by a potent mix of drivers.

Best Forex Brokers with Low Spreads
VERIFIED Low spreads are crucial for reducing trading costs. Explore top Forex brokers offering competitive spreads and high leverage. Compare options for EUR/USD, GBP/USD, USD/JPY, and Gold.